Product Recommendations in RedisGraph, Part 1: Data loading
This post is part of a series on leveraging RedisGraph for product recommendations.
There are so many persistence stores in the world; relational, document, key-value, time series, graph, and on and on… Of all those types, graphs excel at deriving the manner of the interconnectedness of data. This is why social networks are backed by graphs, why fraud systems are often graph-based, and why recommendation engines of most kinds are too!
The first graph system I built, or, really prototyped is the actual usage, was a page recommendation system for a client using AEM. The system leveraged Neo4j and used edge compute to track clients, the cached pages, and track what pages they’d clicked through, the content characteristics of the page, and made live recommendations on subsequent page request. It was awesome. Neo4j, though, is expensive for non-enterprise merchants, and it don’t go anywhere. That was 6 years ago and now there are many other contenders;
… the list, the contenders, goes on and on…
I few months back I stumbled on RedisGraph and thought I’d give it a shot for another PoC or really a “learn Cypher” project, or, more accurately, a “learn openCypher". RedisGraph is, as one might imagine, built atop redis, the swiss army knife of the computing world. The advantages to that are numerous:
- redis is fast
- redis is scalable
- redis is easily useful for many different types of workloads
- redis is … simple.
RedisGraph
From the creators of RedisGraph, it is “the first queryable Property Graph database to use sparse matrices to represent the adjacency matrix in graphs and linear algebra to query the graph.” …which basically means it very, very, very efficiently stores your vertices and edges and their properties in memory for very fast query execution.
RedisLabs is the primary maintainer of the RedisGraph module, and in addition to it they make a slick and full-featured web UI. The UI, RedisInsight, is awesome for interacting with your graph and is quite similar to the visualizations supported by Neo4j. The UI is not just for RedisGraph, but for RedisSearch, Time Series, etc… RedisInsight can be obtained through their website, but, more conveniently (in my opinion) via docker:
docker run -p 8001:8001 -it --rm redislabs/redisinsight
A Product Recommendations data model
Alright, let’s switch gears and get into the modeling part of this proof of concept. First, the vertices and edges:
- person (id, name, address, age, memberSince)
- product (id, name, manufacturer, msrp)
- order (id, subTotal, tax, shipping, total)
and the following edges are supported:
- view (timestamp)
- addtocart (timestamp)
- transact
- contain
The relationships are as follows:
- Person views product
- Person adds product to cart
- Person transacts order which contains products
The data generation is fairly realistic. People’s names and address are believable as are products thanks to Java Faker. Products bought are randomly split between 1-to-n orders of a subset of those added to cart of a subset of those viewed.
Orders contain valid sums of products associated with them, etc…
Second, let’s go over the scripts themselves. There are two; one that connects to the RedisGraph instance and creates all the vertices and edges programmatically and is representative of what you might do in actual (Java) code deployment. The second generates the same data, but writes to CSV files to be used by RedisGraph’s bulk load utility. The following are the links to the two utilities:
Graph Generation
There are variables common to both scripts. In fact, the only non-common variable is the batch size parameter for the first, which should not be modified. The other tuning parameters for data generation are as follows:
def maxPotentialViews = 50
def minPotentialViews = 0
def percentageOfViewsToAddToCart = 25
def percentageOfAddToCartToPurchase = 15
def maxRandomTimeFromViewToAddToCartInMinutes = 4320
def maxRandomTimeFromAddToCartToPurchased = 4320
def maxPastDate = 365 * 20
def maxPotentialPeopleToCreate = 1_001
def minPotentialPeopleToCreate = 1_000
def maxPotentialProductsToCreate = 1_001
def minPotentialProductsToCreate = 1_000
def nodeCreationBatchSize = 500
def maxTaxRate =  0.125
def minTaxRate = 0.0
def maxShipRate = 0.15
def minShipRate = 0.0
def minPerProductPrice = 0.99
def maxPerProductPrice = 1000.00
Of these, the four you’ll probably be most interesting in tuning are the min/max people and products:
minPotentialPeopleToCreate/maxPotentialPeopleToCreateminPotentialProductsToCreate/maxPotentialProductsToCreate
Right now the min and max of both are set to 1000 and 1001, respectively, meaning the generators create 1000 of each people and products. For the performance samples that follow I have the people set to min/max of 25000/25001.
Programmatic Generation of the Graph
I’m going to assume Docker familiarity with all these examples.
- Run
redisgraphwith a data volume, allowing us to save our graph:docker run -p 6379:6379 -it --rm -v redis-data:/data redislabs/redisgraph:edge. If you’ve been running this for a while, it occasionally helps to explicitly pull theredislabs/redisgraph:edgetag. - With groovy installed, run
groovy 1-create_local_commerce_graph.groovy. The script will output what its doing as it executes – it won’t leave you in the dark.
Bulk Loading Generation of the Graph
- Run
redisgraphwith a data volume, allowing us to save our graph:docker run -p 6379:6379 -it --rm -v redis-data:/data redislabs/redisgraph:edge. If you’ve been running this for a while, it occasionally helps to explicitly pull theredislabs/redisgraph:edgetag. - Clone the bulk loader utility:
git clone git@github.com:RedisGraph/redisgraph-bulk-loader.git - Change directory into the newly cloned bulk loader:
cd redisgraph-bulk-loader - Create a Python virtual env for this work:
python3 -m venv redisgraphloader - Step into the venv:
source redisgraphloader/bin/activate - Install the dependencies for the bulk loader:
pip install -r requirements.txt - Pull down the groovy script
wget https://raw.githubusercontent.com/joshdurbin/redis-graph-commerce-poc/master/2-create-csvs-for-bulk-import.groovy - Execute the groovy script, to generate the CSVs for the vertices and edges:
groovy 2-create-csvs-for-bulk-import.groovy
Note the structure of the CSVs:
(redisgraphloader) ➜  redisgraph-bulk-loader git:(master) ✗ head -n2 *.csv
==> addtocart.csv <==
src_person,dst_product,timestamp
0,158328,2016-09-25T03:53:36.160952

==> contain.csv <==
src_person,dst_order
175000,160230

==> order.csv <==
_internalid,id,subTotal,tax,shipping,total
175000,0,681.33,65.28,61.88,808.49

==> person.csv <==
_internalid,id,name,address,age,memberSince
0,0,Gertrude Baumbach,Apt. 677 4680 Jae Estate Lake Vincenzo SC 77433-9279,65,2008-05-26T09:21:36.160952

==> product.csv <==
_internalid,id,name,manufacturer,msrp
150000,0,Sleek Leather Car,Orn and Sons,21.99

==> transact.csv <==
src_person,dst_order
0,175000

==> view.csv <==
src_person,dst_product,timestamp
0,158328,2016-09-24T02:27:36.160952
The person, product, and order vertices have an internal, unique ID that’s used as part of the import process. The leading _ in the first
row of the import CSV denotes that the field should not be imported into the graph.
- Run the bulk loader:
python bulk_insert.py prodrec-bulk -n person.csv -n product.csv -n order.csv -r view.csv -r addtocart.csv -r transact.csv -r contain.csv(read usage for more info)
Performance, trade offs
The bulk loader is much faster than the programmatic creator as it uses the GRAPH.BULK operator (see more and more).
For smaller data sets the difference is negligible, but for larger data sets the MATCH criteria on edge creation starts to become expensive, especially as the product vertex count bounds upward.
Here’s an example of the first, programmatic script run and timing:
Finished creating 25000 'person', 1000 'product', 27897 'order', 234727 'view' edges, 61070 'addtocart' edges, 27897 'transact' edges, and 40181 'contain' products edges in 626164 ms...
… which is ~10 min 30 seconds.
The bulk loader, with roughly the same outcomes (in terms of counts) has the following output summarization:
person  [####################################]  100%
25000 nodes created with label 'person'
1000 nodes created with label 'product'
order  [####################################]  100%
27966 nodes created with label 'order'
view  [####################################]  100%
235988 relations created for type 'view'
addtocart  [####################################]  100%
61288 relations created for type 'addtocart'
27966 relations created for type 'transact'
contain  [####################################]  100%
40327 relations created for type 'contain'
Construction of graph 'test' complete: 53966 nodes created, 365569 relations created in 12.129039 seconds
Play.
Accessing your graph
First off, you can always, simply access your graph using the Redis command line. The following
is the docker execution of the Redis command line utility: docker run -it --network host --rm redis redis-cli -h 127.0.0.1
Once you’re connected, you can easily save the graph to the data volume attached by Docker.
127.0.0.1:6379> save
OK
(0.53s)
…and you can query for data using a query like:
match (p:person) where p.id=200 return p.nameExecuted:
127.0.0.1:6379> graph.query prodrec "match (p:person) where p.id=200 return p.name"
1) 1) "p.name"
2) 1) 1) "Denver Jerde"
3) 1) "Query internal execution time: 4.937000 milliseconds"
Note: Keep in mind the programmatic script writes to the graph prodrec, while the bulk utility writes to prodrec-bulk.
Visualizing your graph
This assumes you’ve already got the RedisInsight container running. If not; docker run -p 8001:8001 -it --rm redislabs/redisinsight
Once you’ve got that running, do the following:
- Point your browser at
http://localhost:8001 - Accept the EULA
- Create a connection to your RedisGraph instance at, in my case,
docker.for.mac.localhost - Connect to the console
- Select RedisGraph and select either the
prodrecorprodrec-bulkgraphs.
Now, a few things to be aware of when you’re using RedisInsigh for RedisGraph:
- Here we don’t need to prefix calls to Redis using
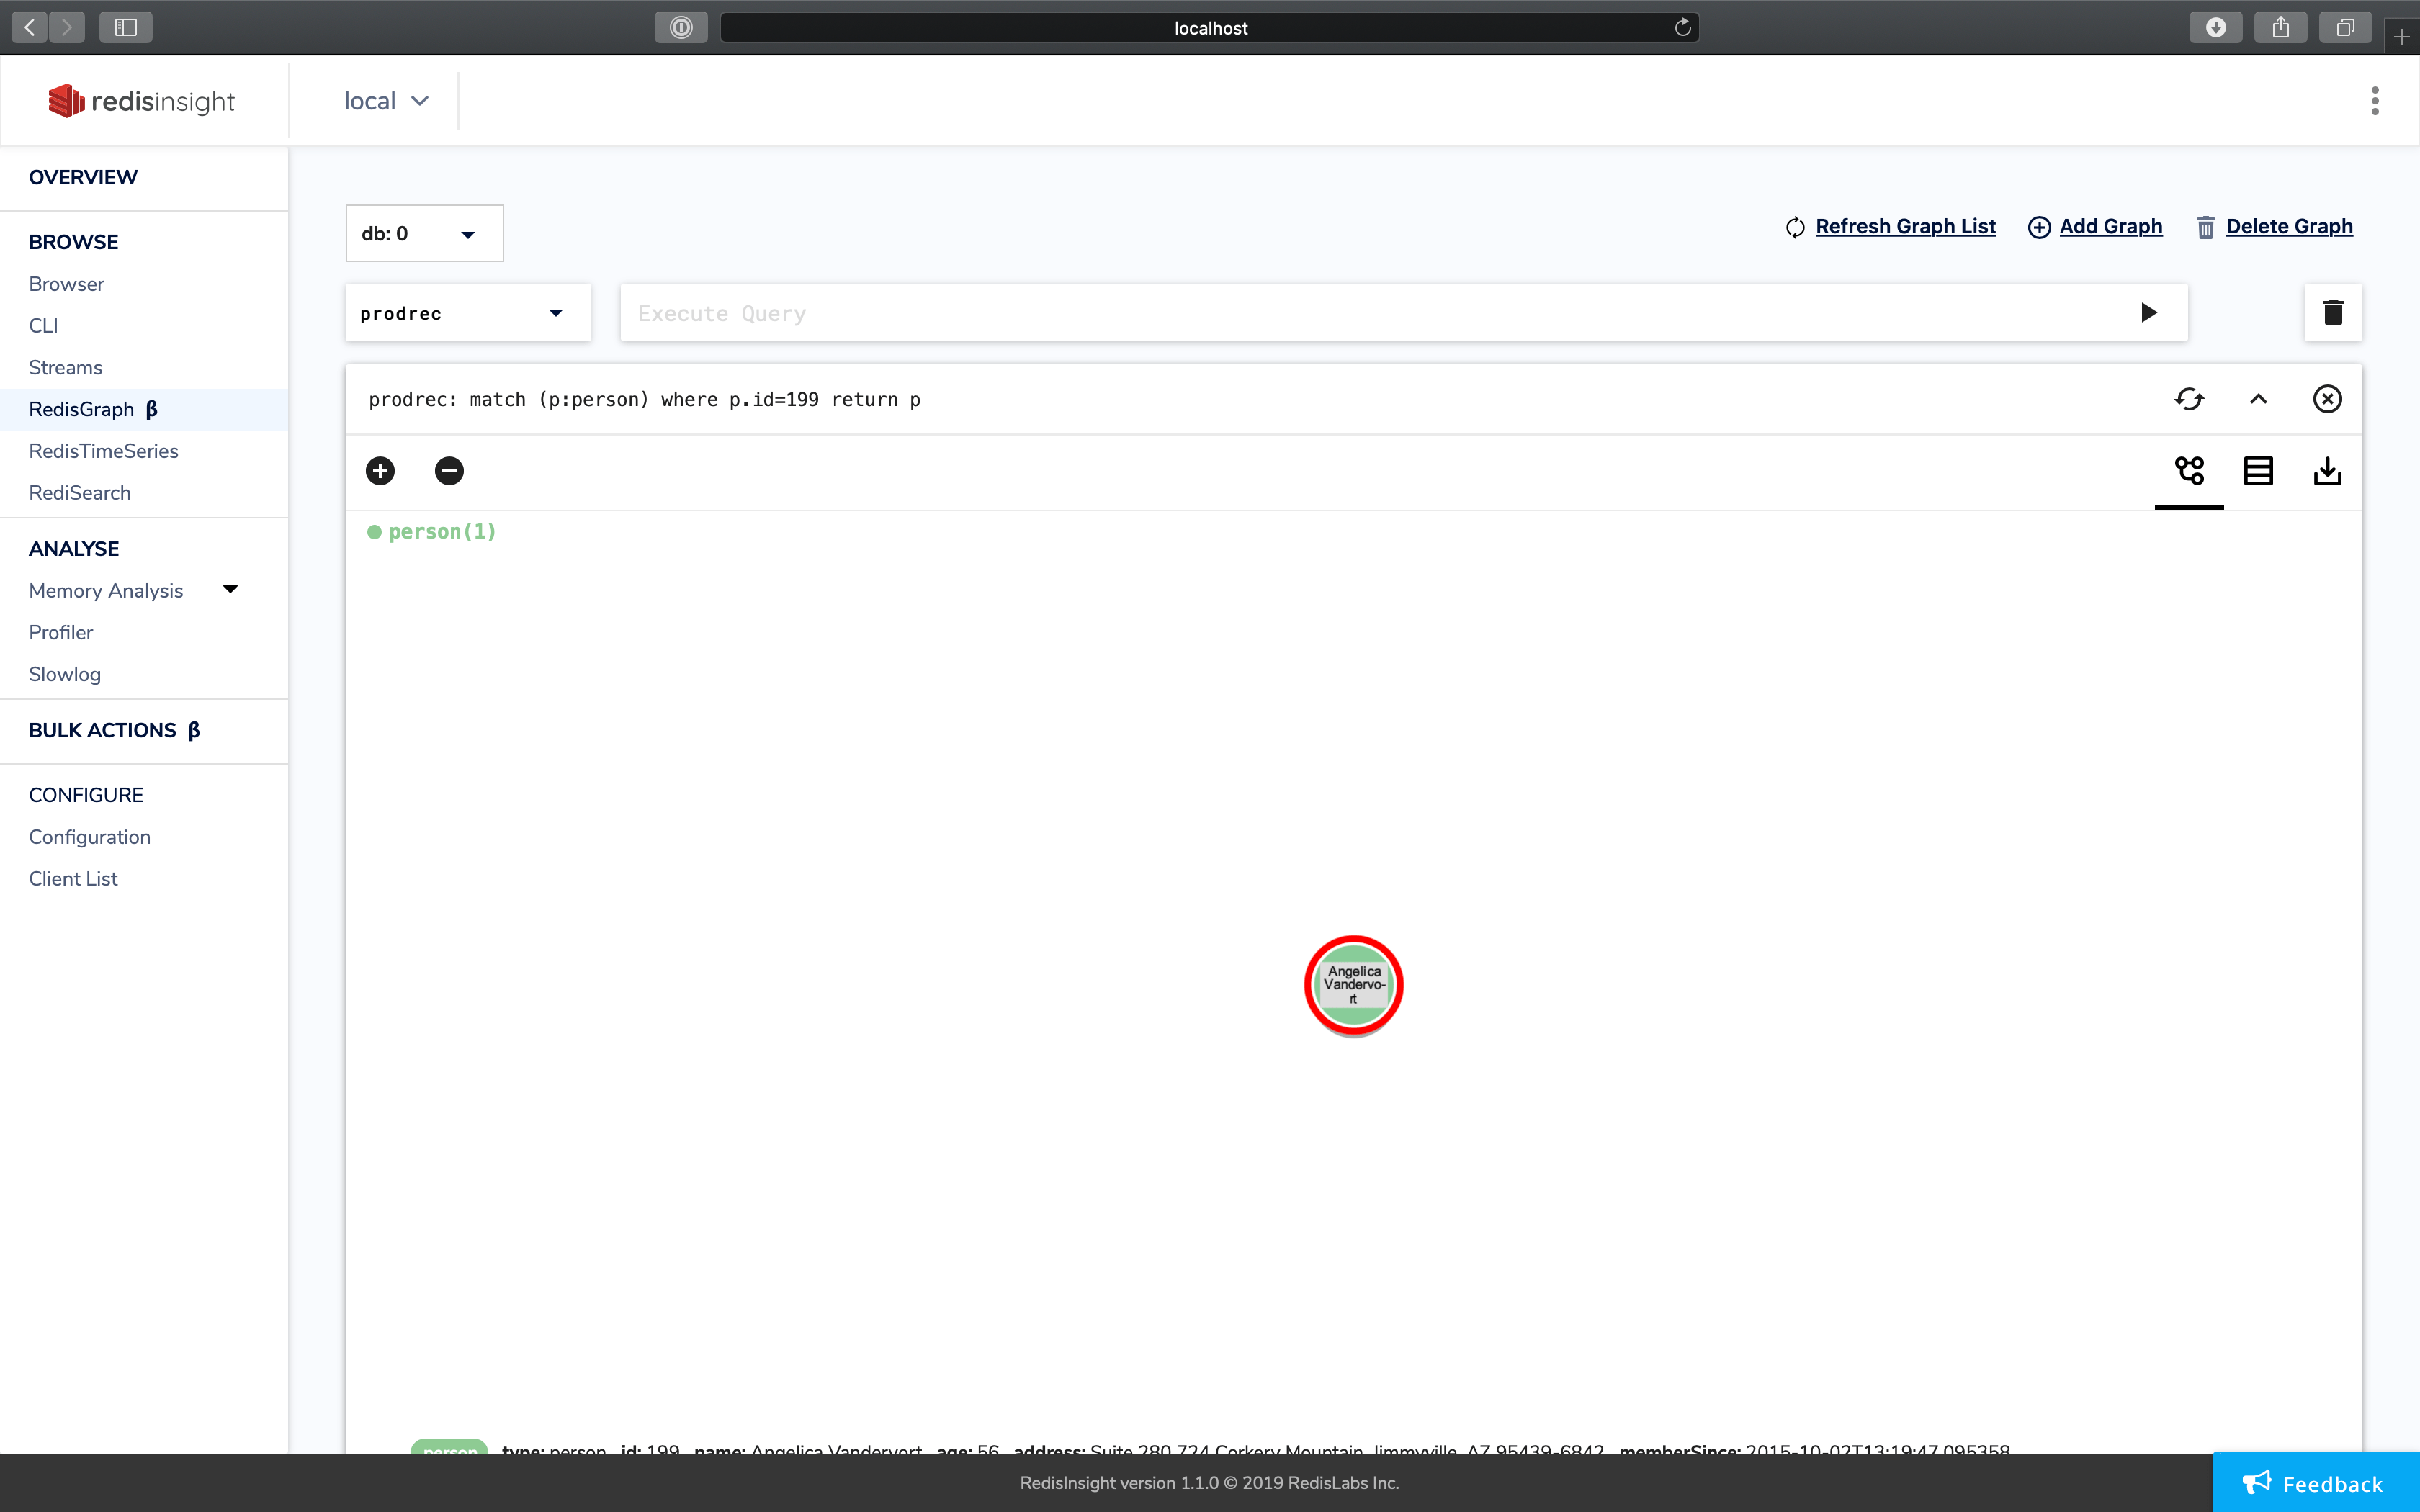
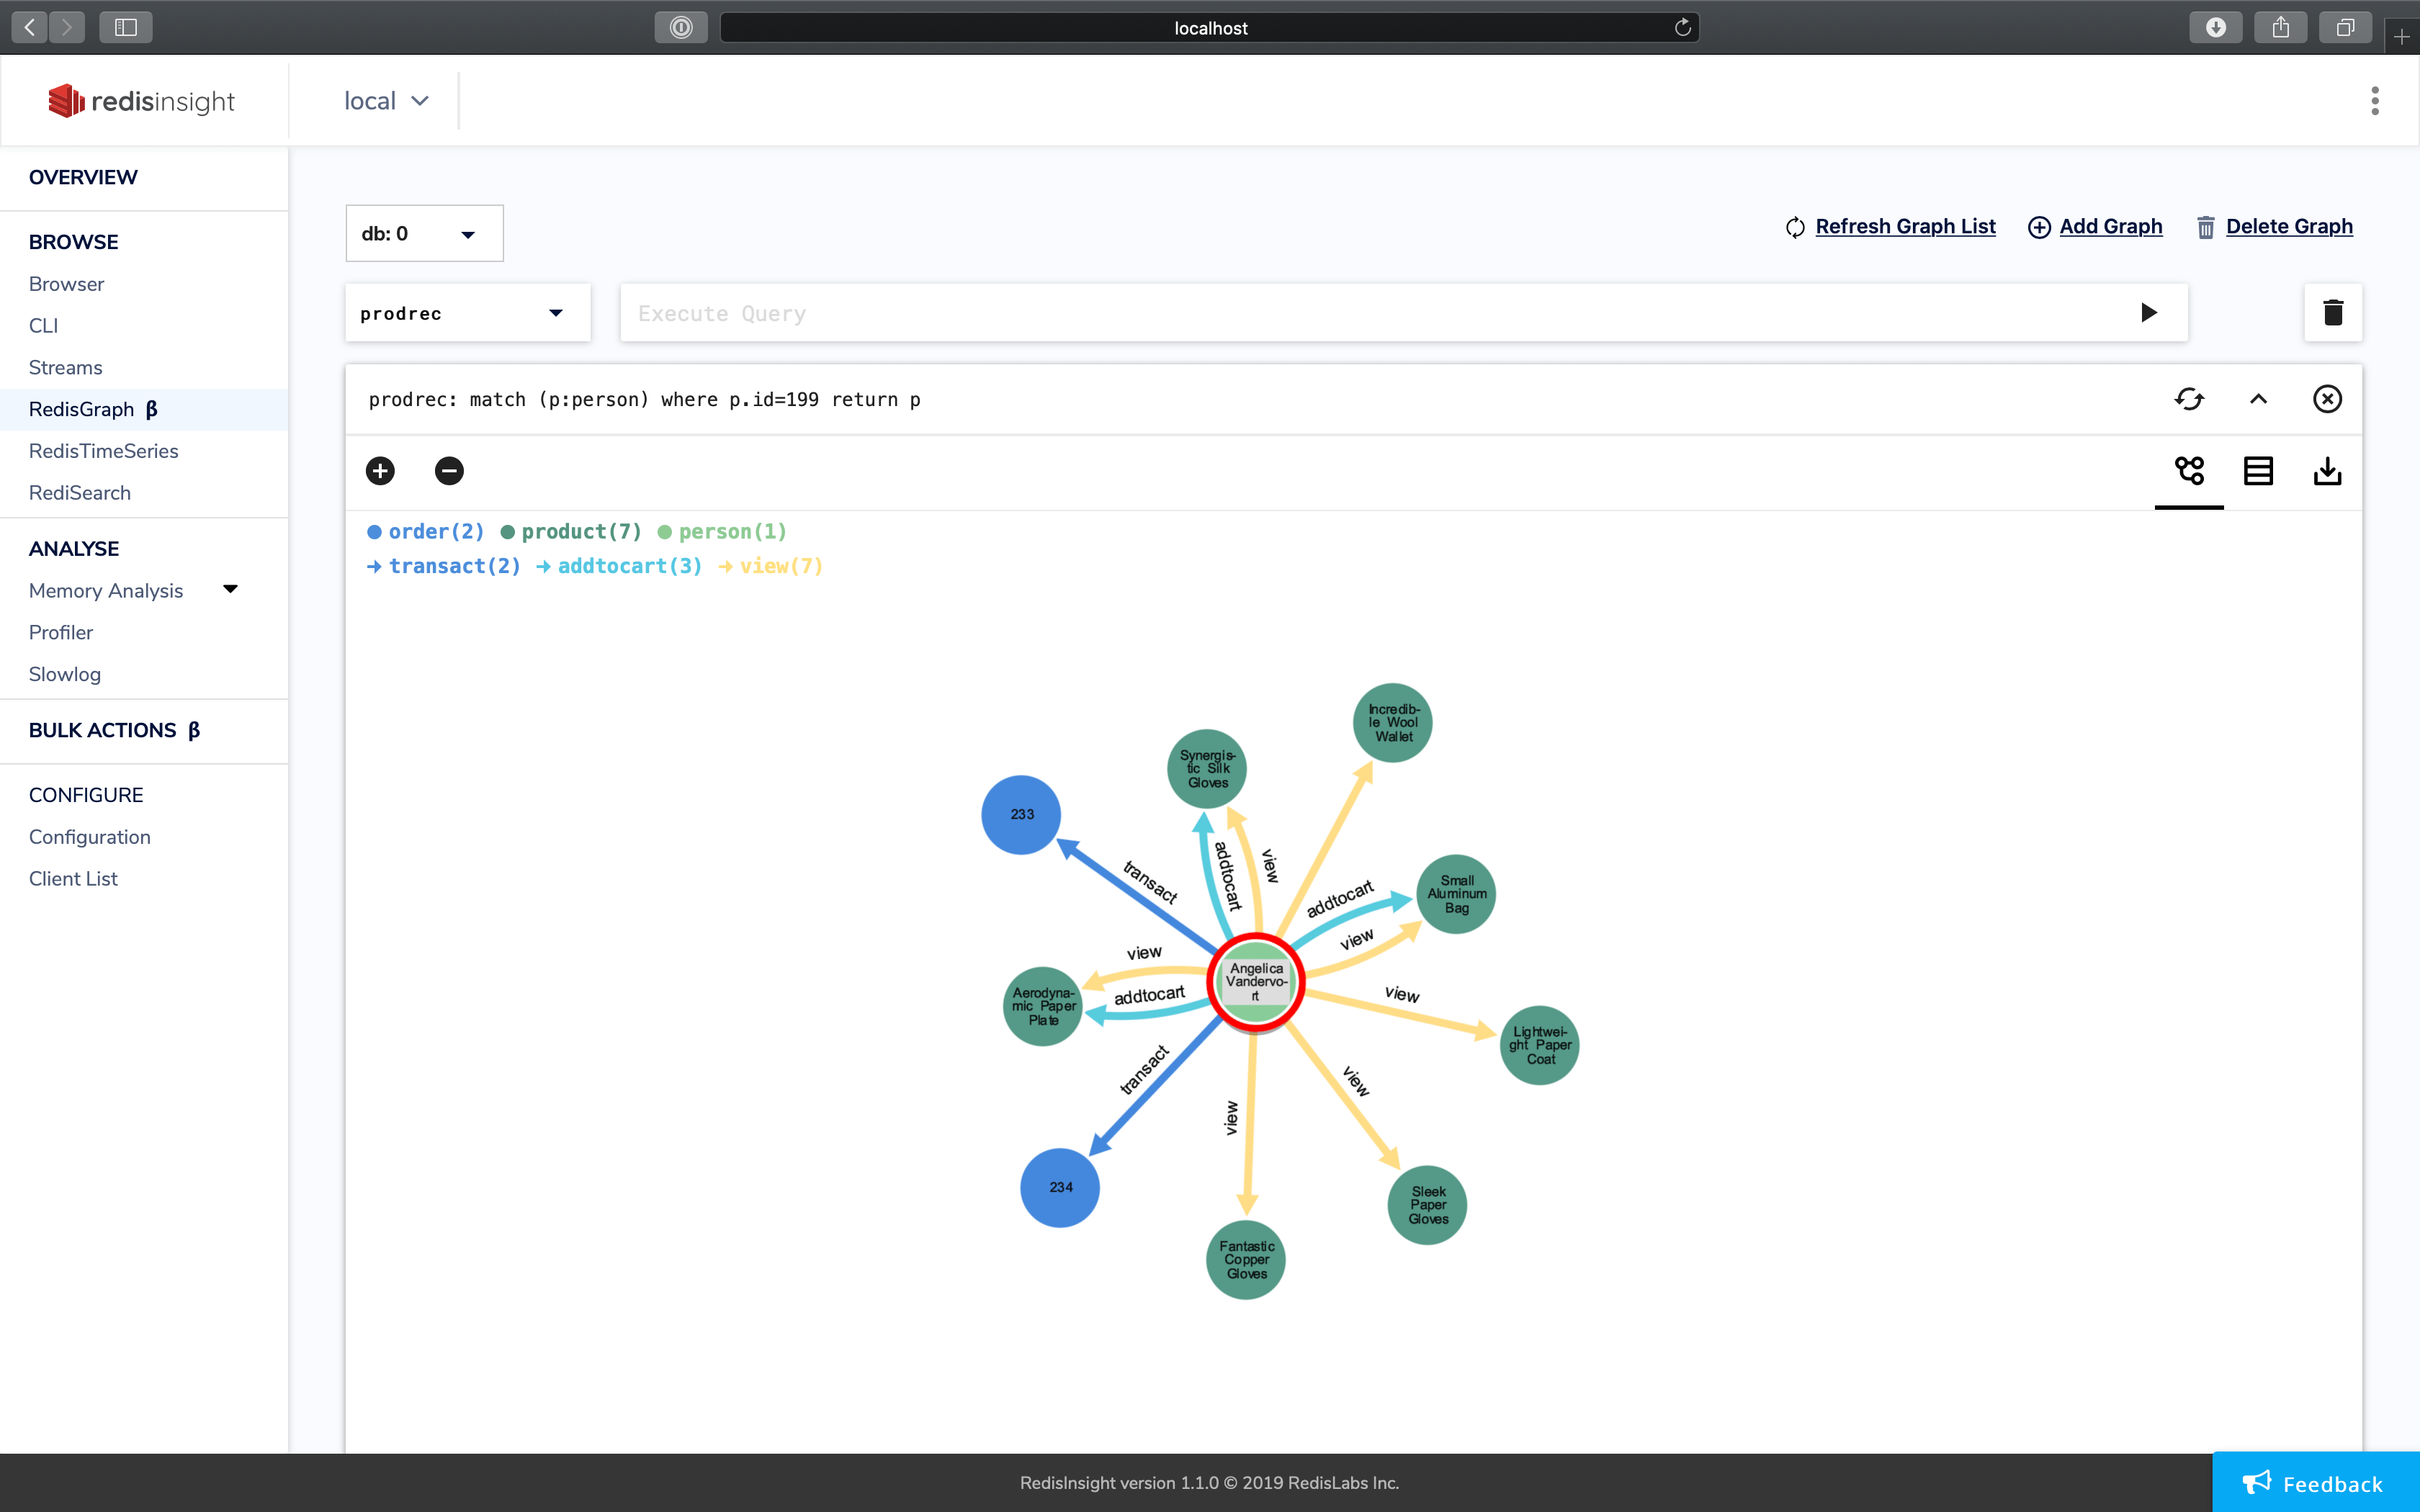
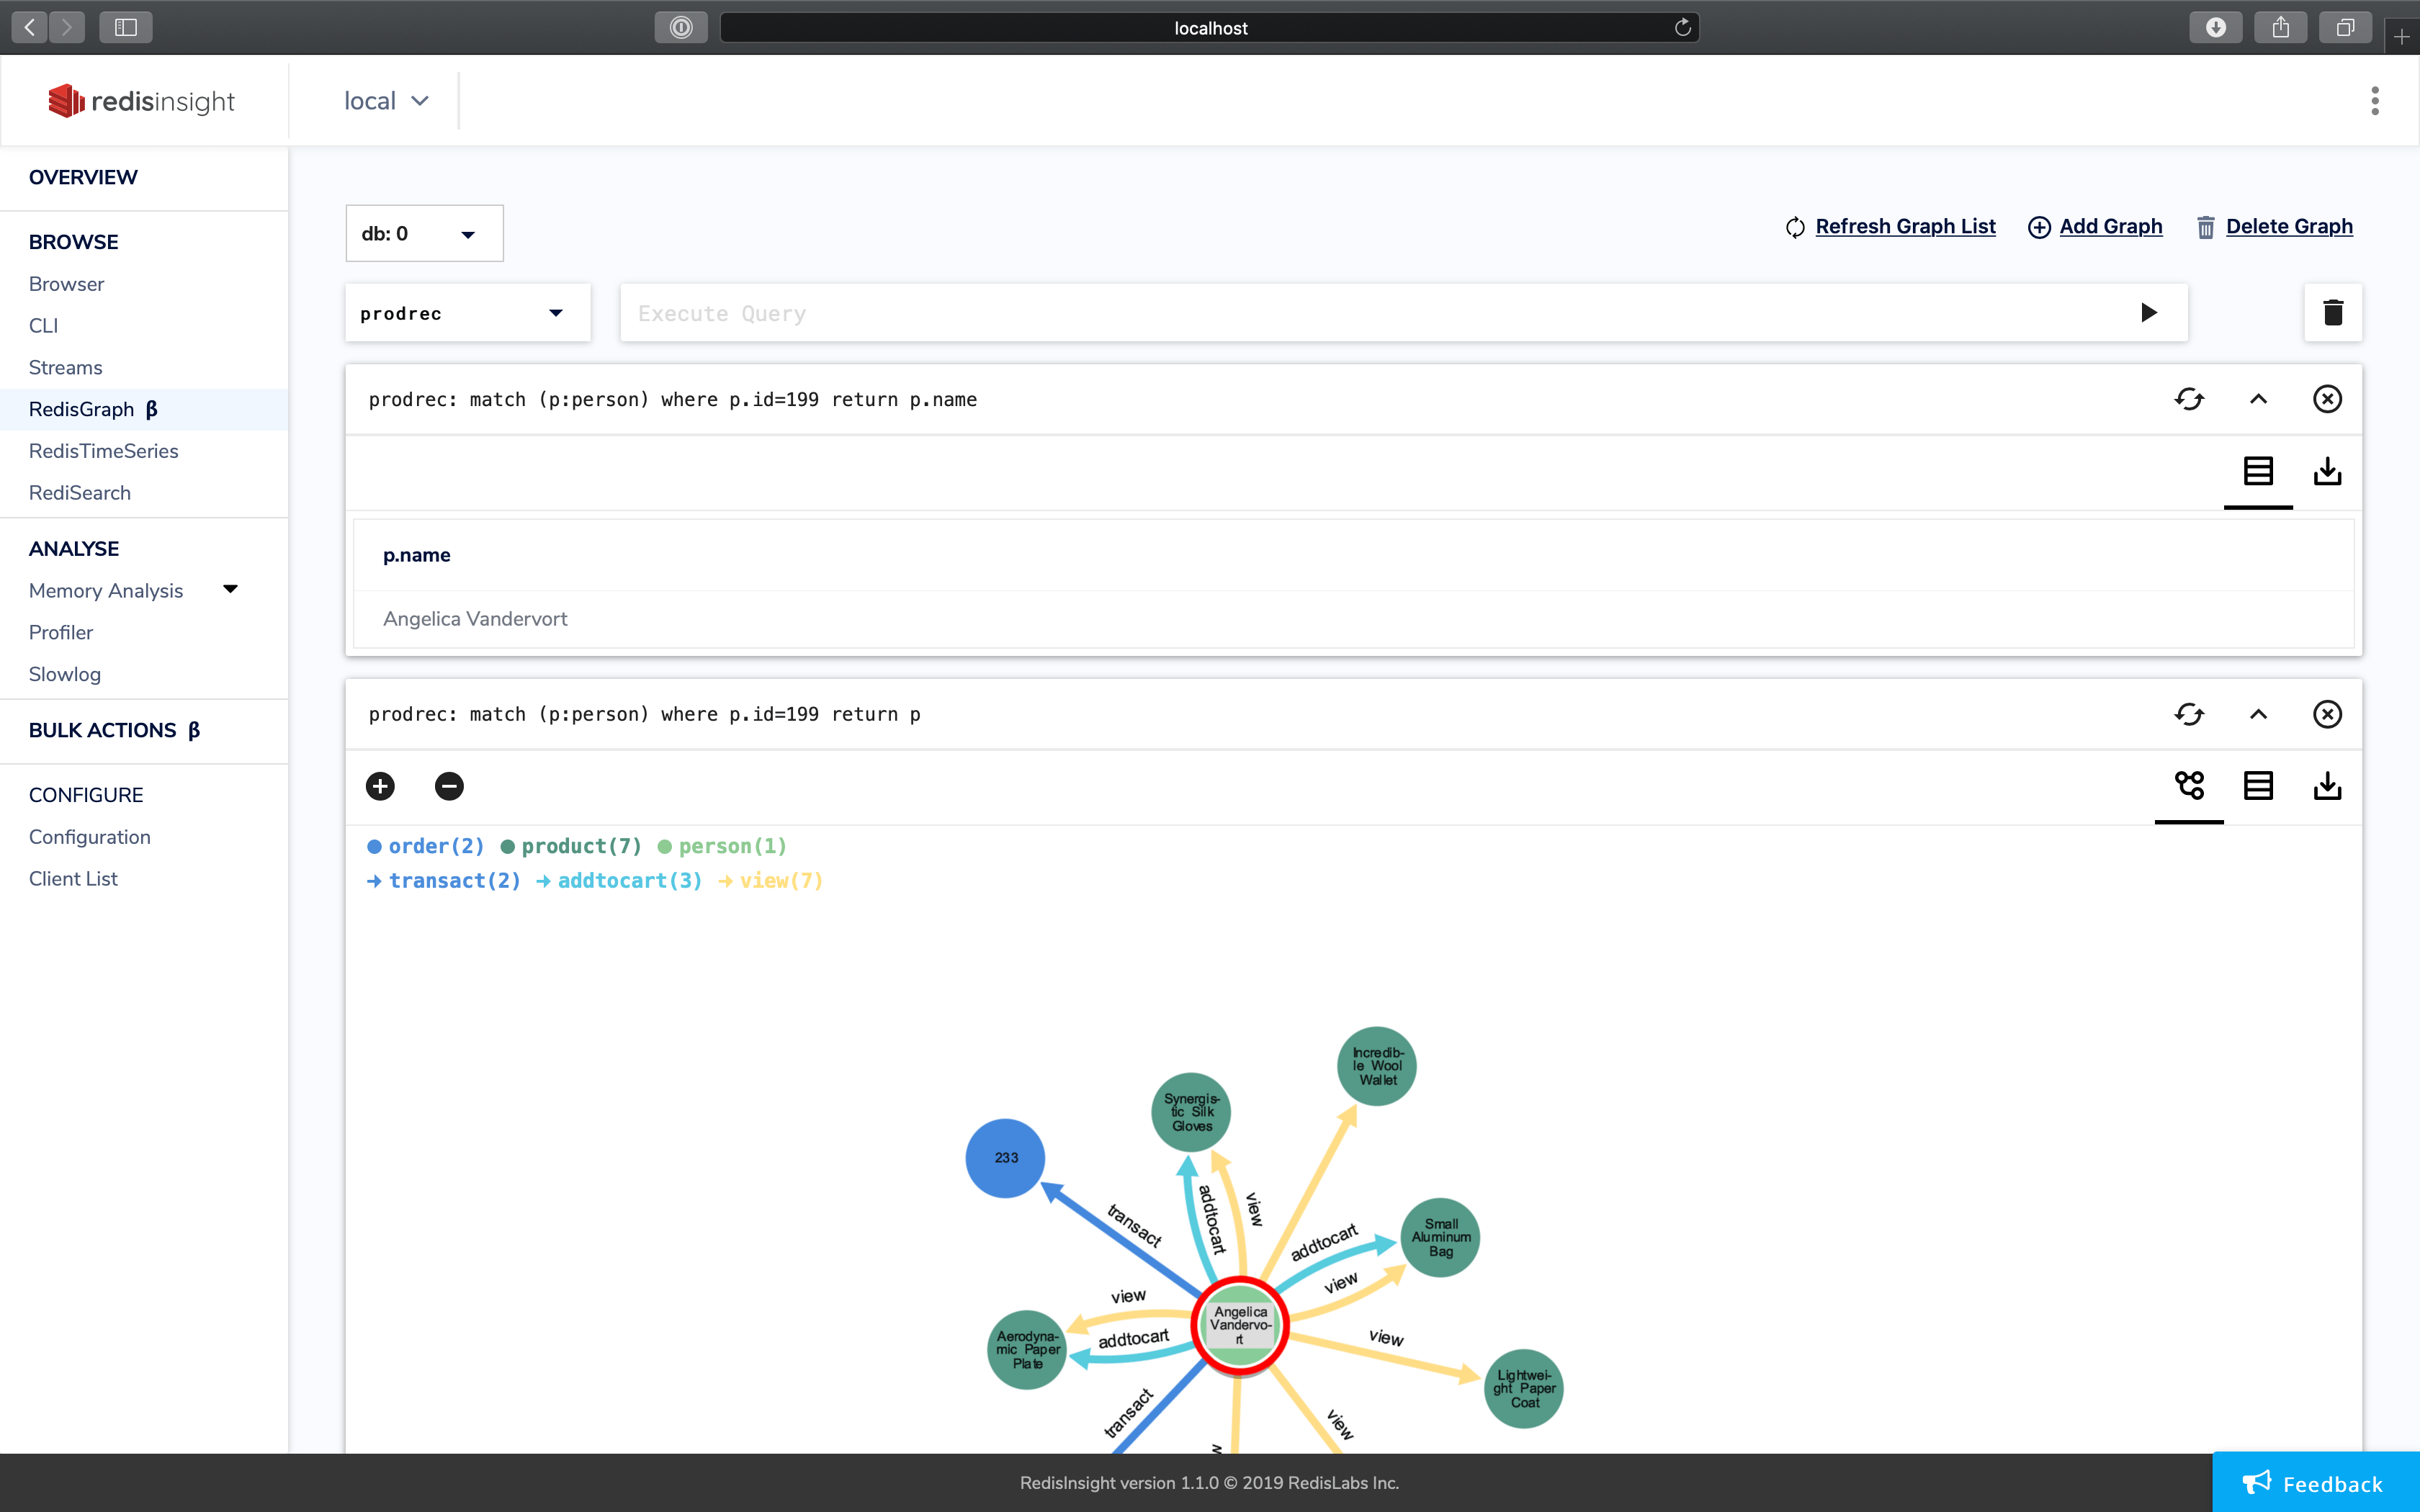
graph.query - When you return a vertex from a query, say:
match (p:person) where p.id=199 return p…a visualization of the graph will render.
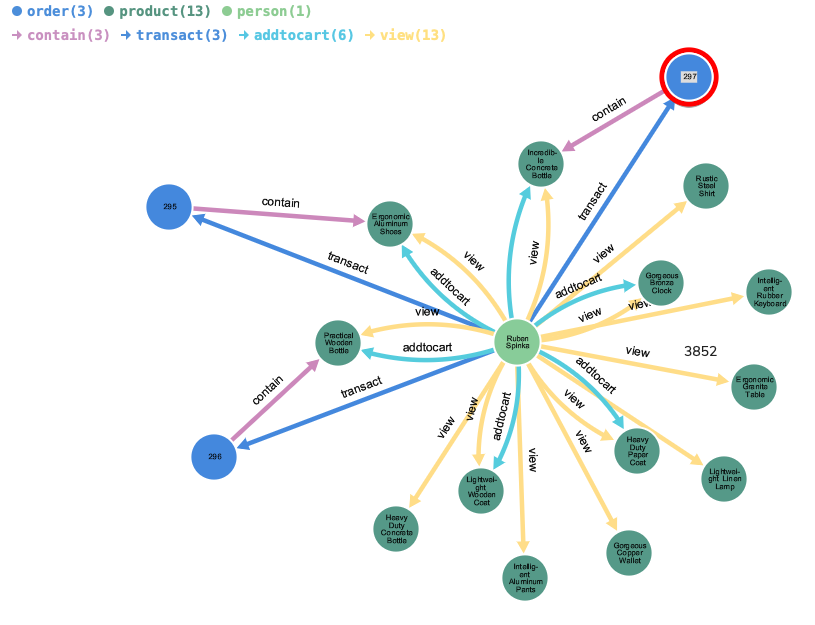
- You can double click on any vertex and it will show you the connecting edges to other vertices in the system.
- If you don’t render a vertex, data will be listed in table format.
Summary
A post in the next week or two will dive into queries against this data to actually generate product recommendations. Stay tuned!