GCP Stackdriver Topology
Google announced many things at Google Cloud NEXT 18 this year; one newly accounted tool I found particularly intriguing was Stackdriver Toplogy. Stackdriver Topology generates graphs showing traffic between resources based on the resources within a project and no additional configuration. Its particularly useful in diagnostic and infrastructure verification exercises.
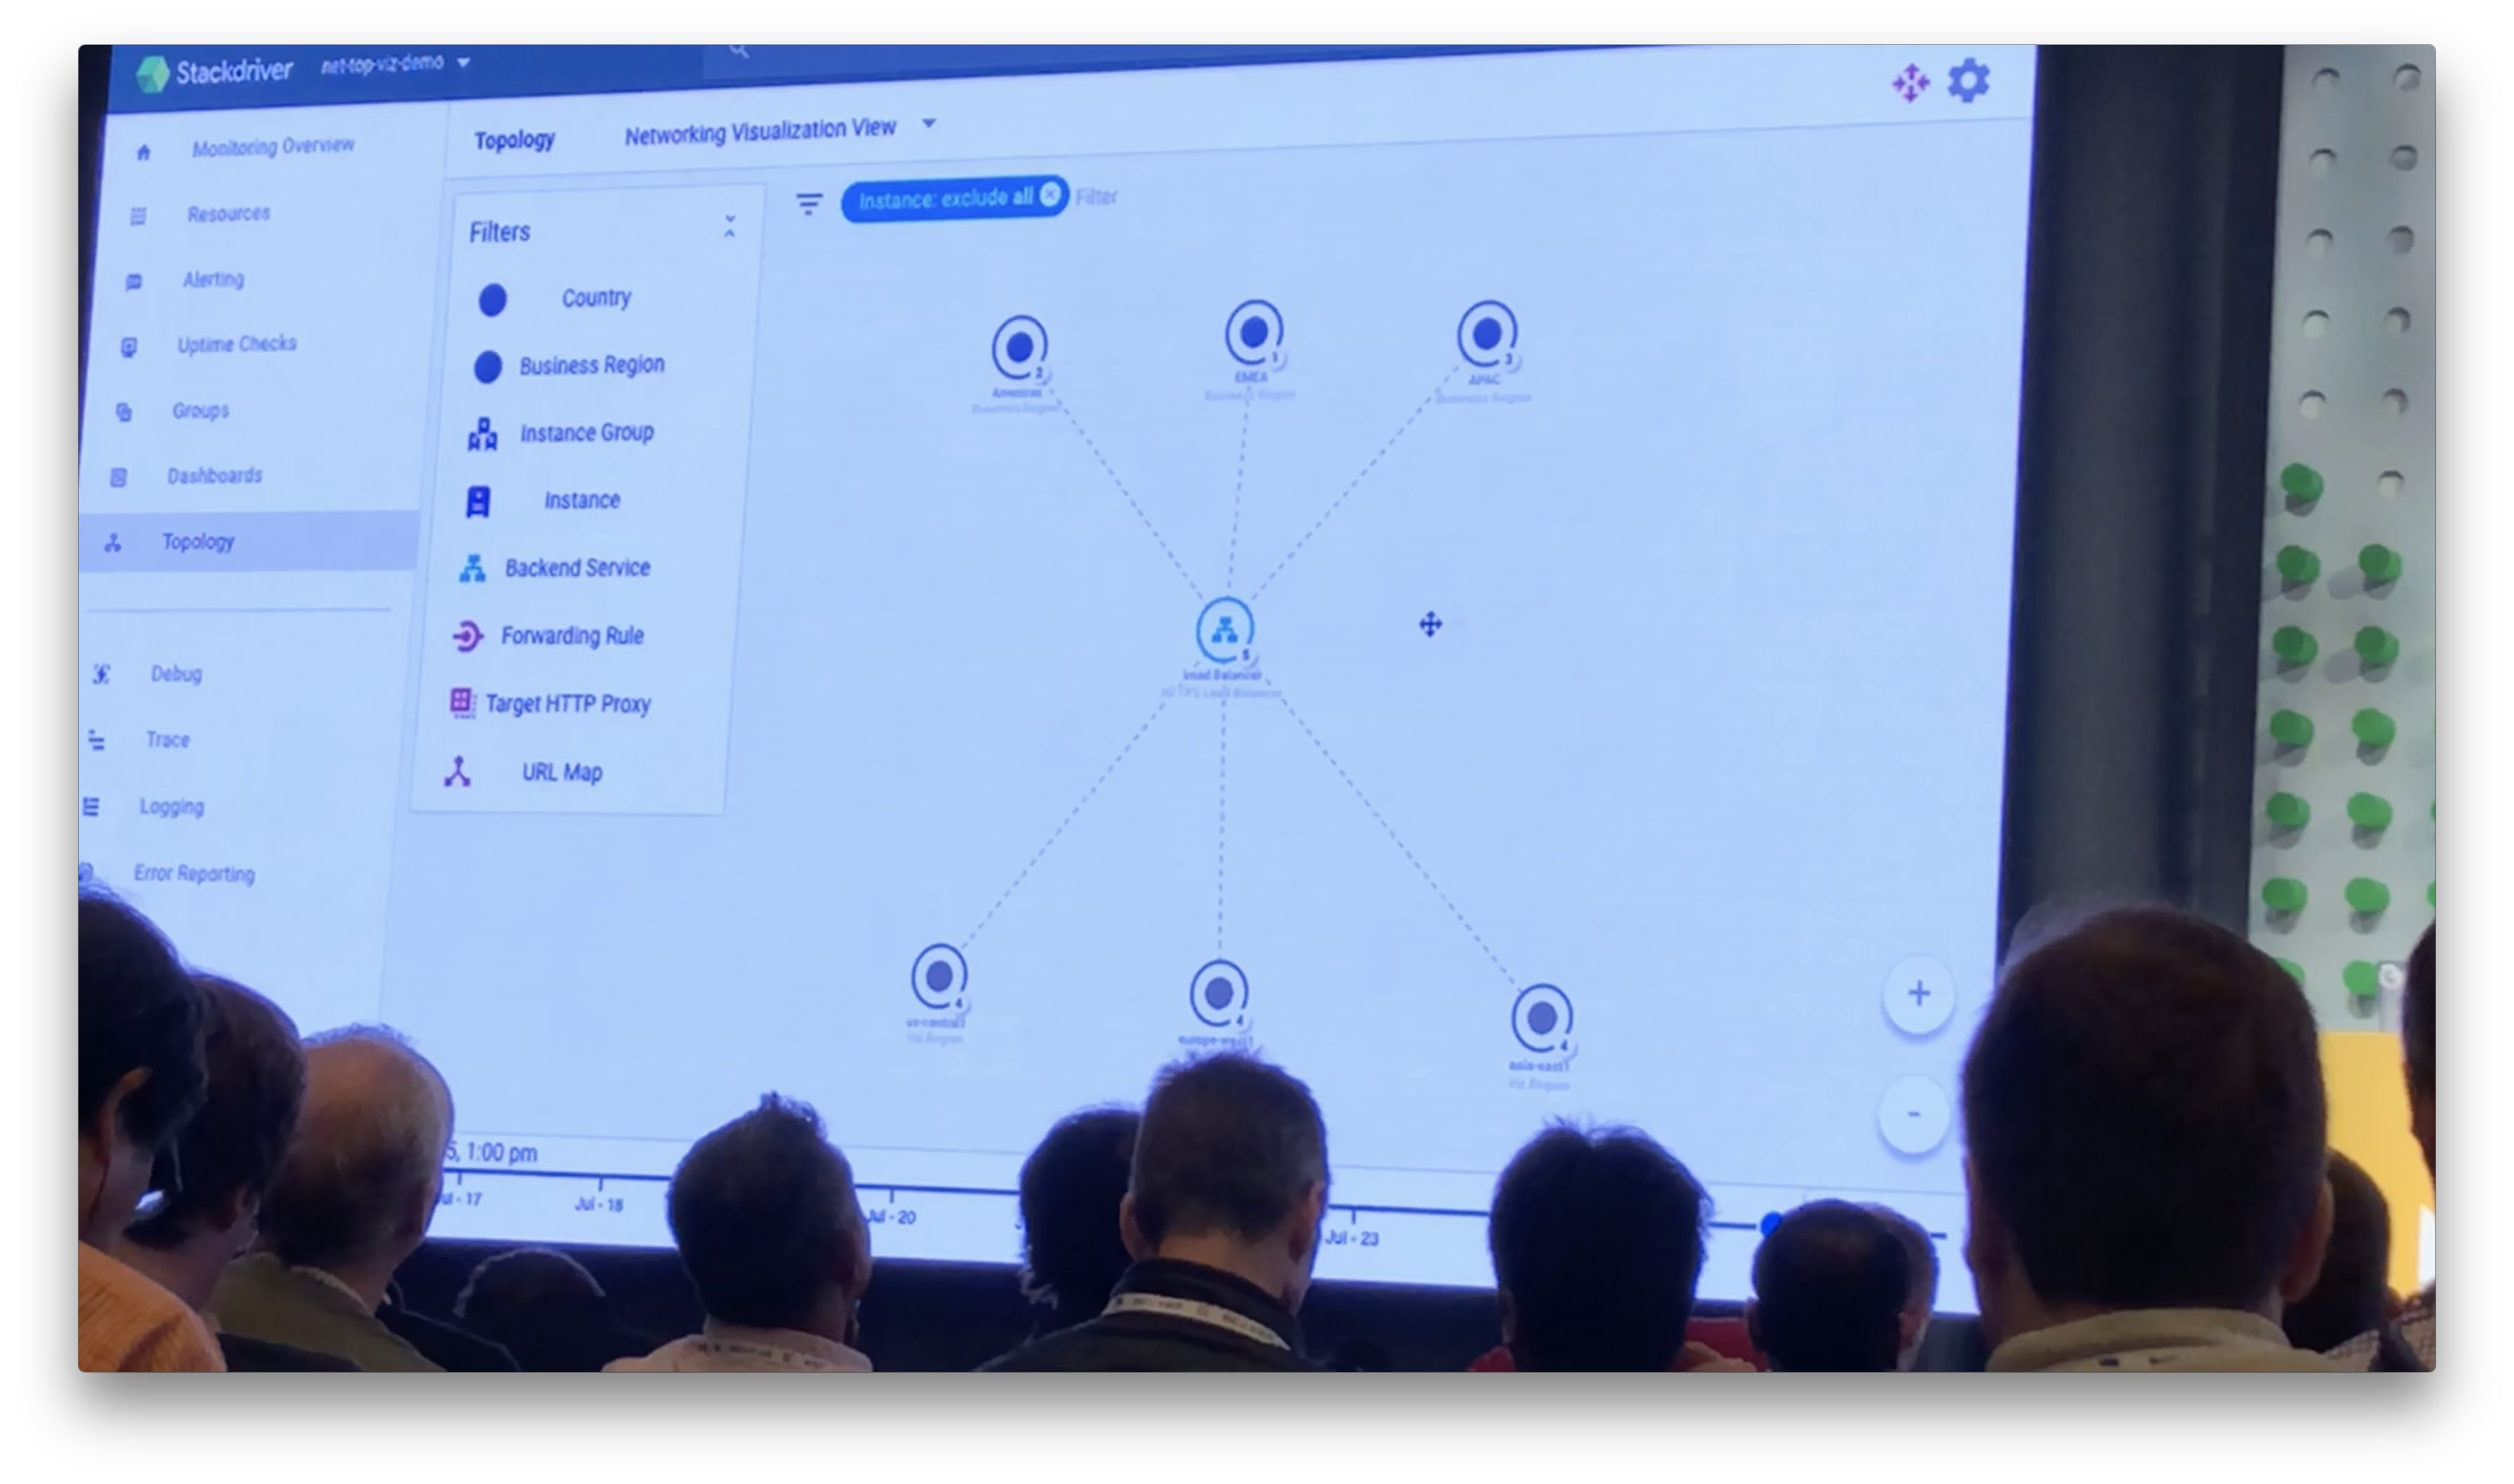
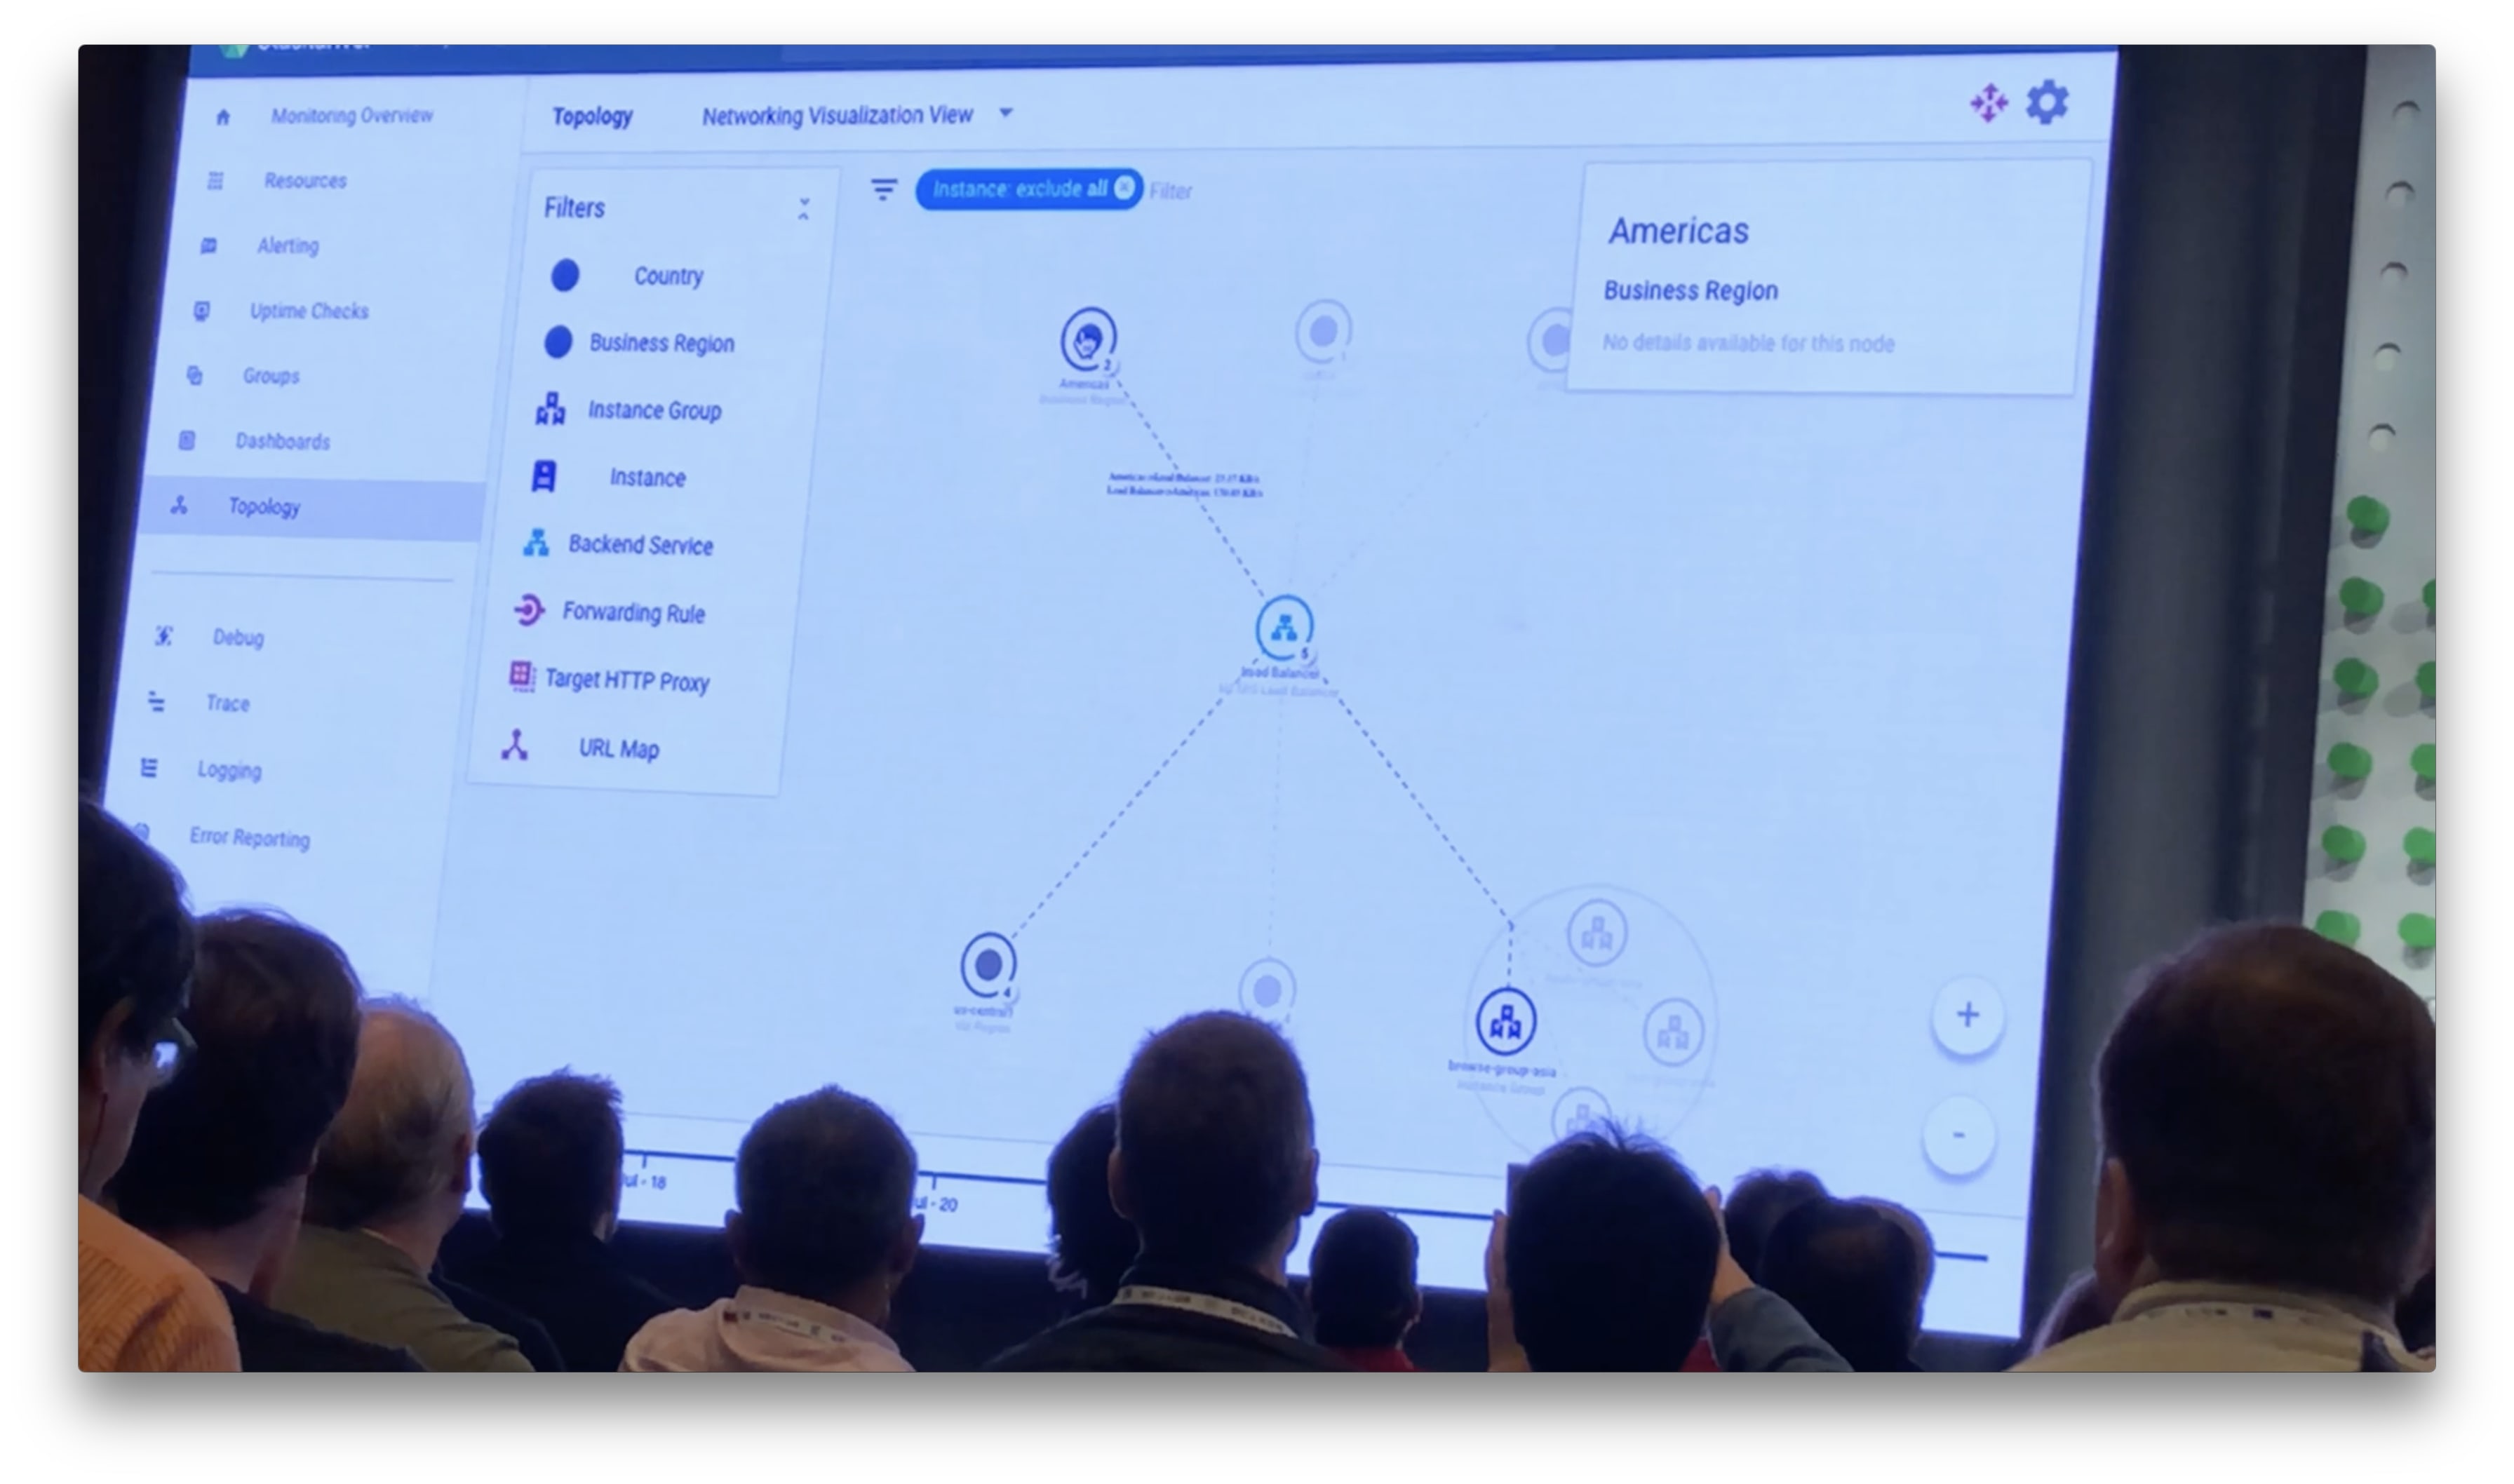
Take the following image that shows 3 business regions, a global load balancer (middle), and compute regions.
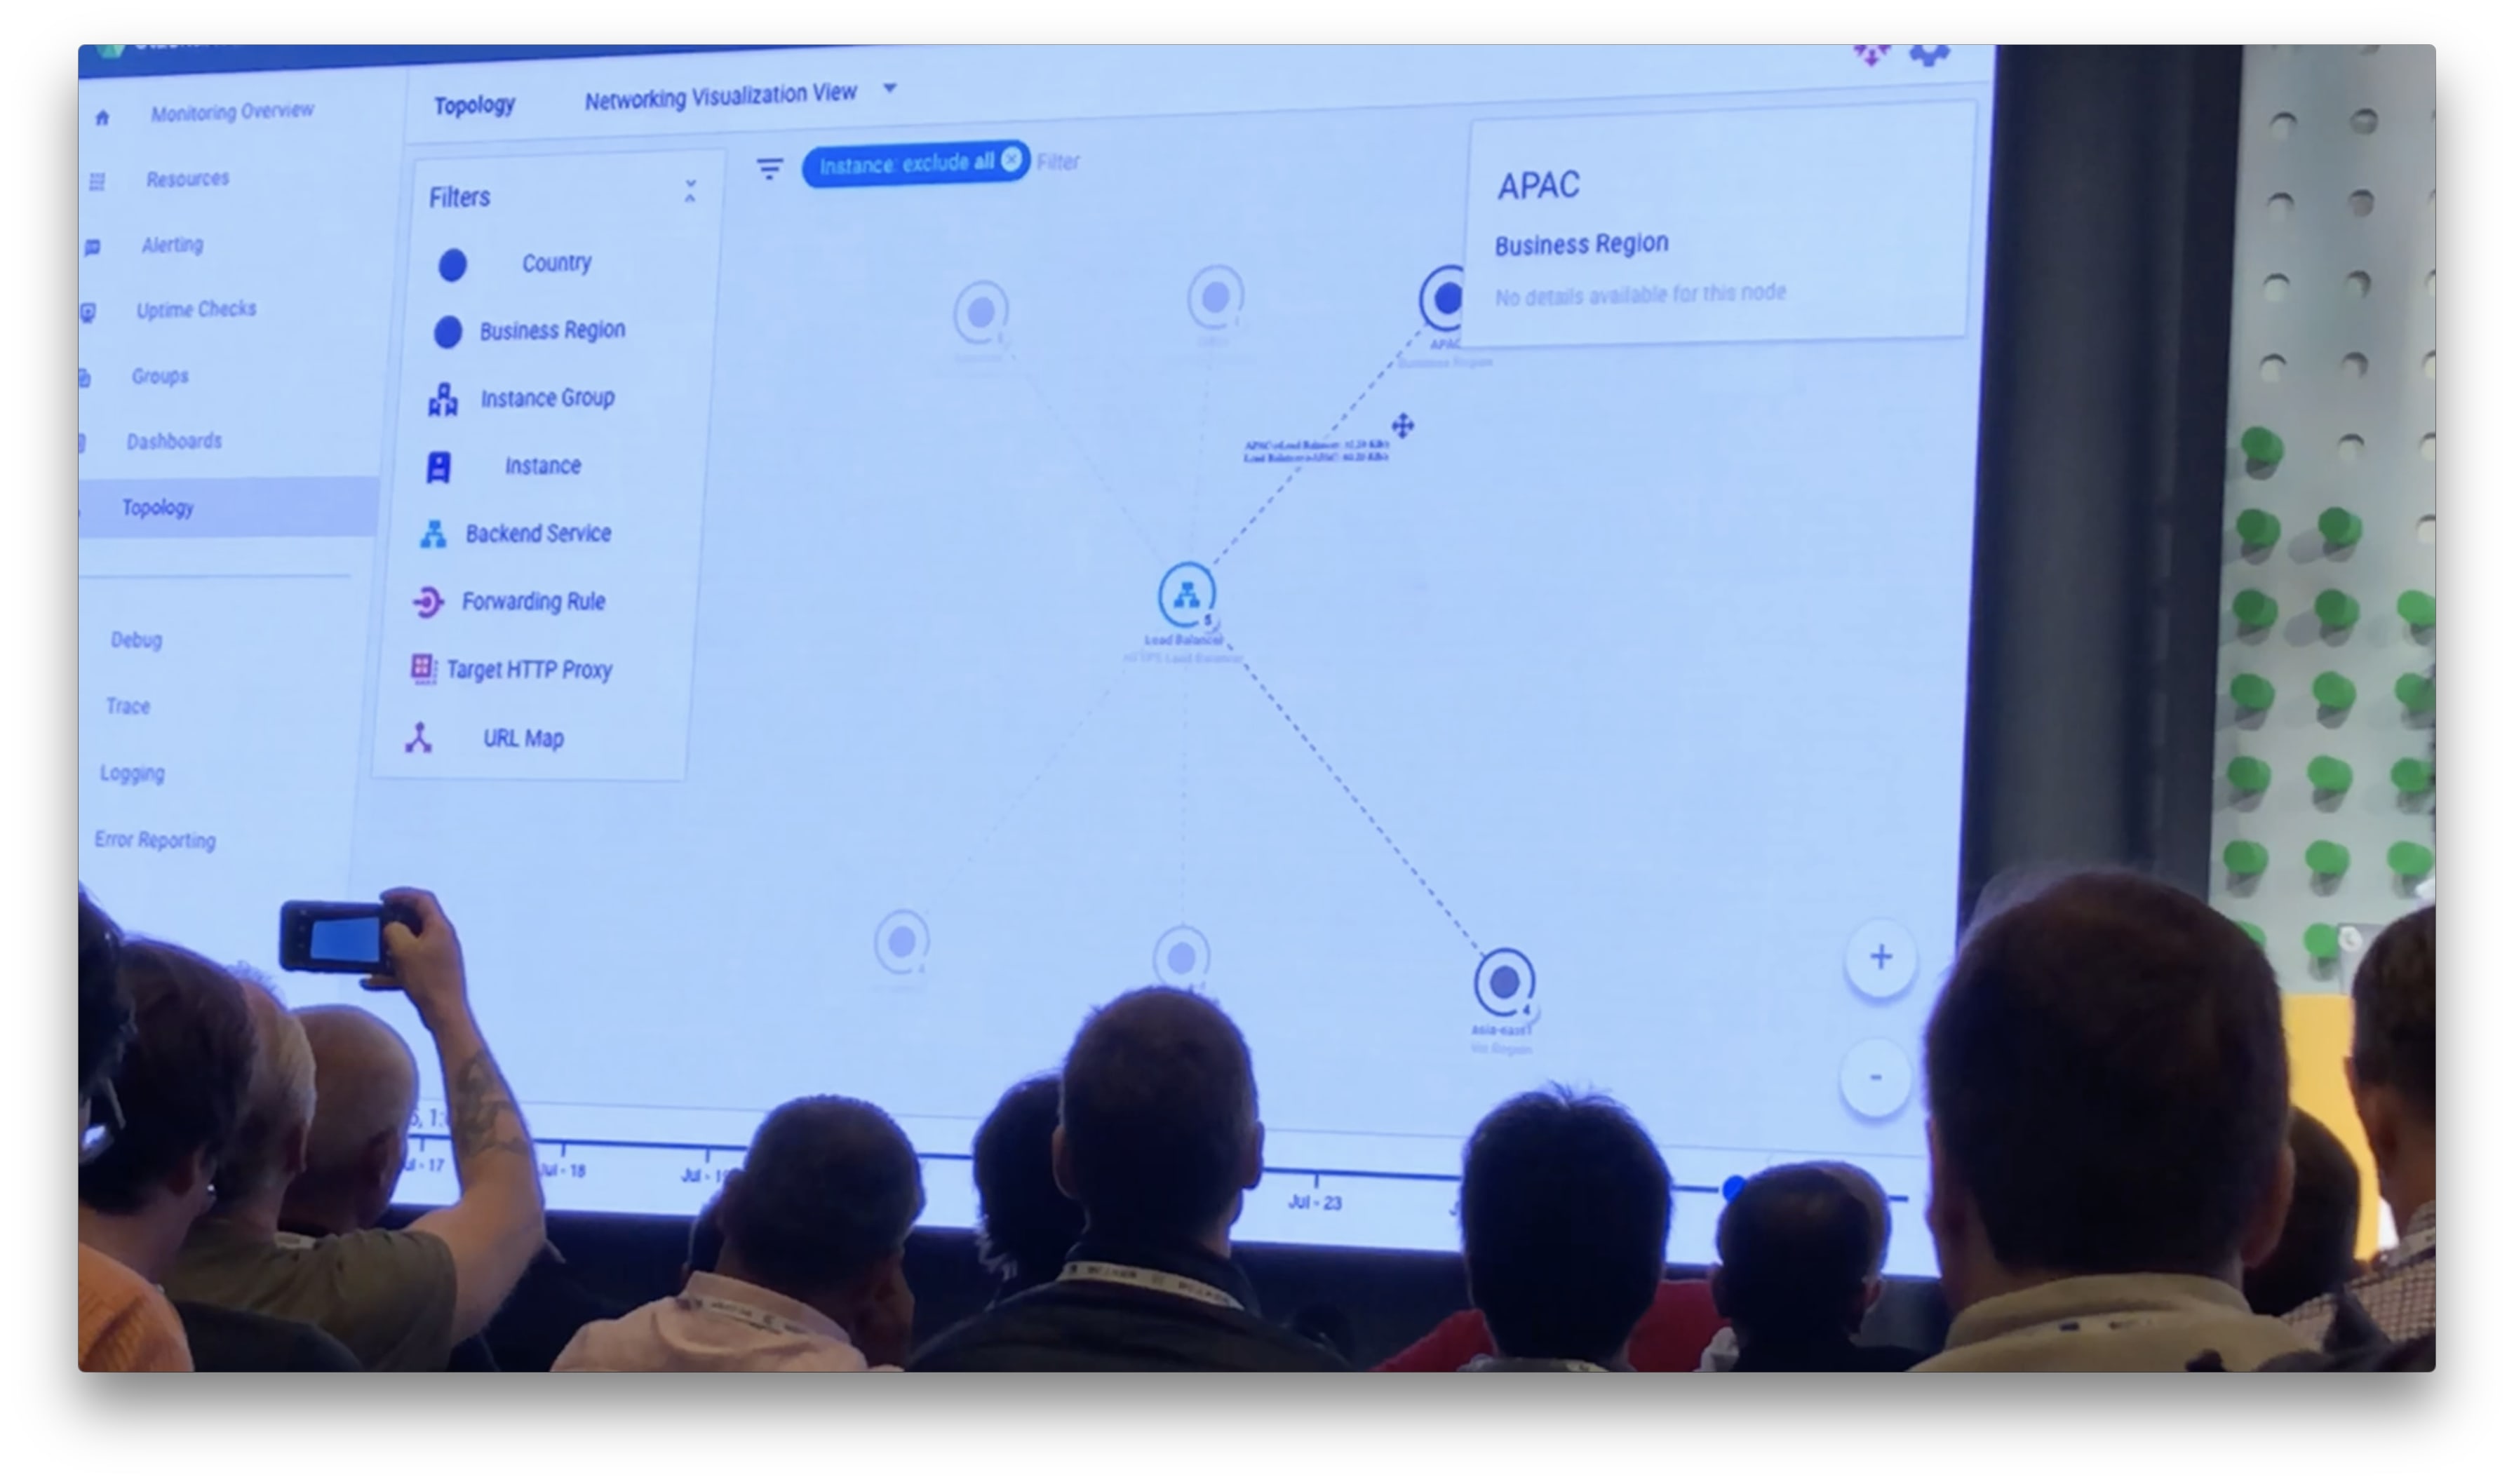
The interactive map allows a user to select a particular business region (in this case APAC) and verify that the traffic routing from that region routes to the closest compute region. This is ideal for obvious performance, latency, and cost reasons. The following image shows this in addition to other vital stats like real time traffic rates in and out of that region through the particular global load balancer.
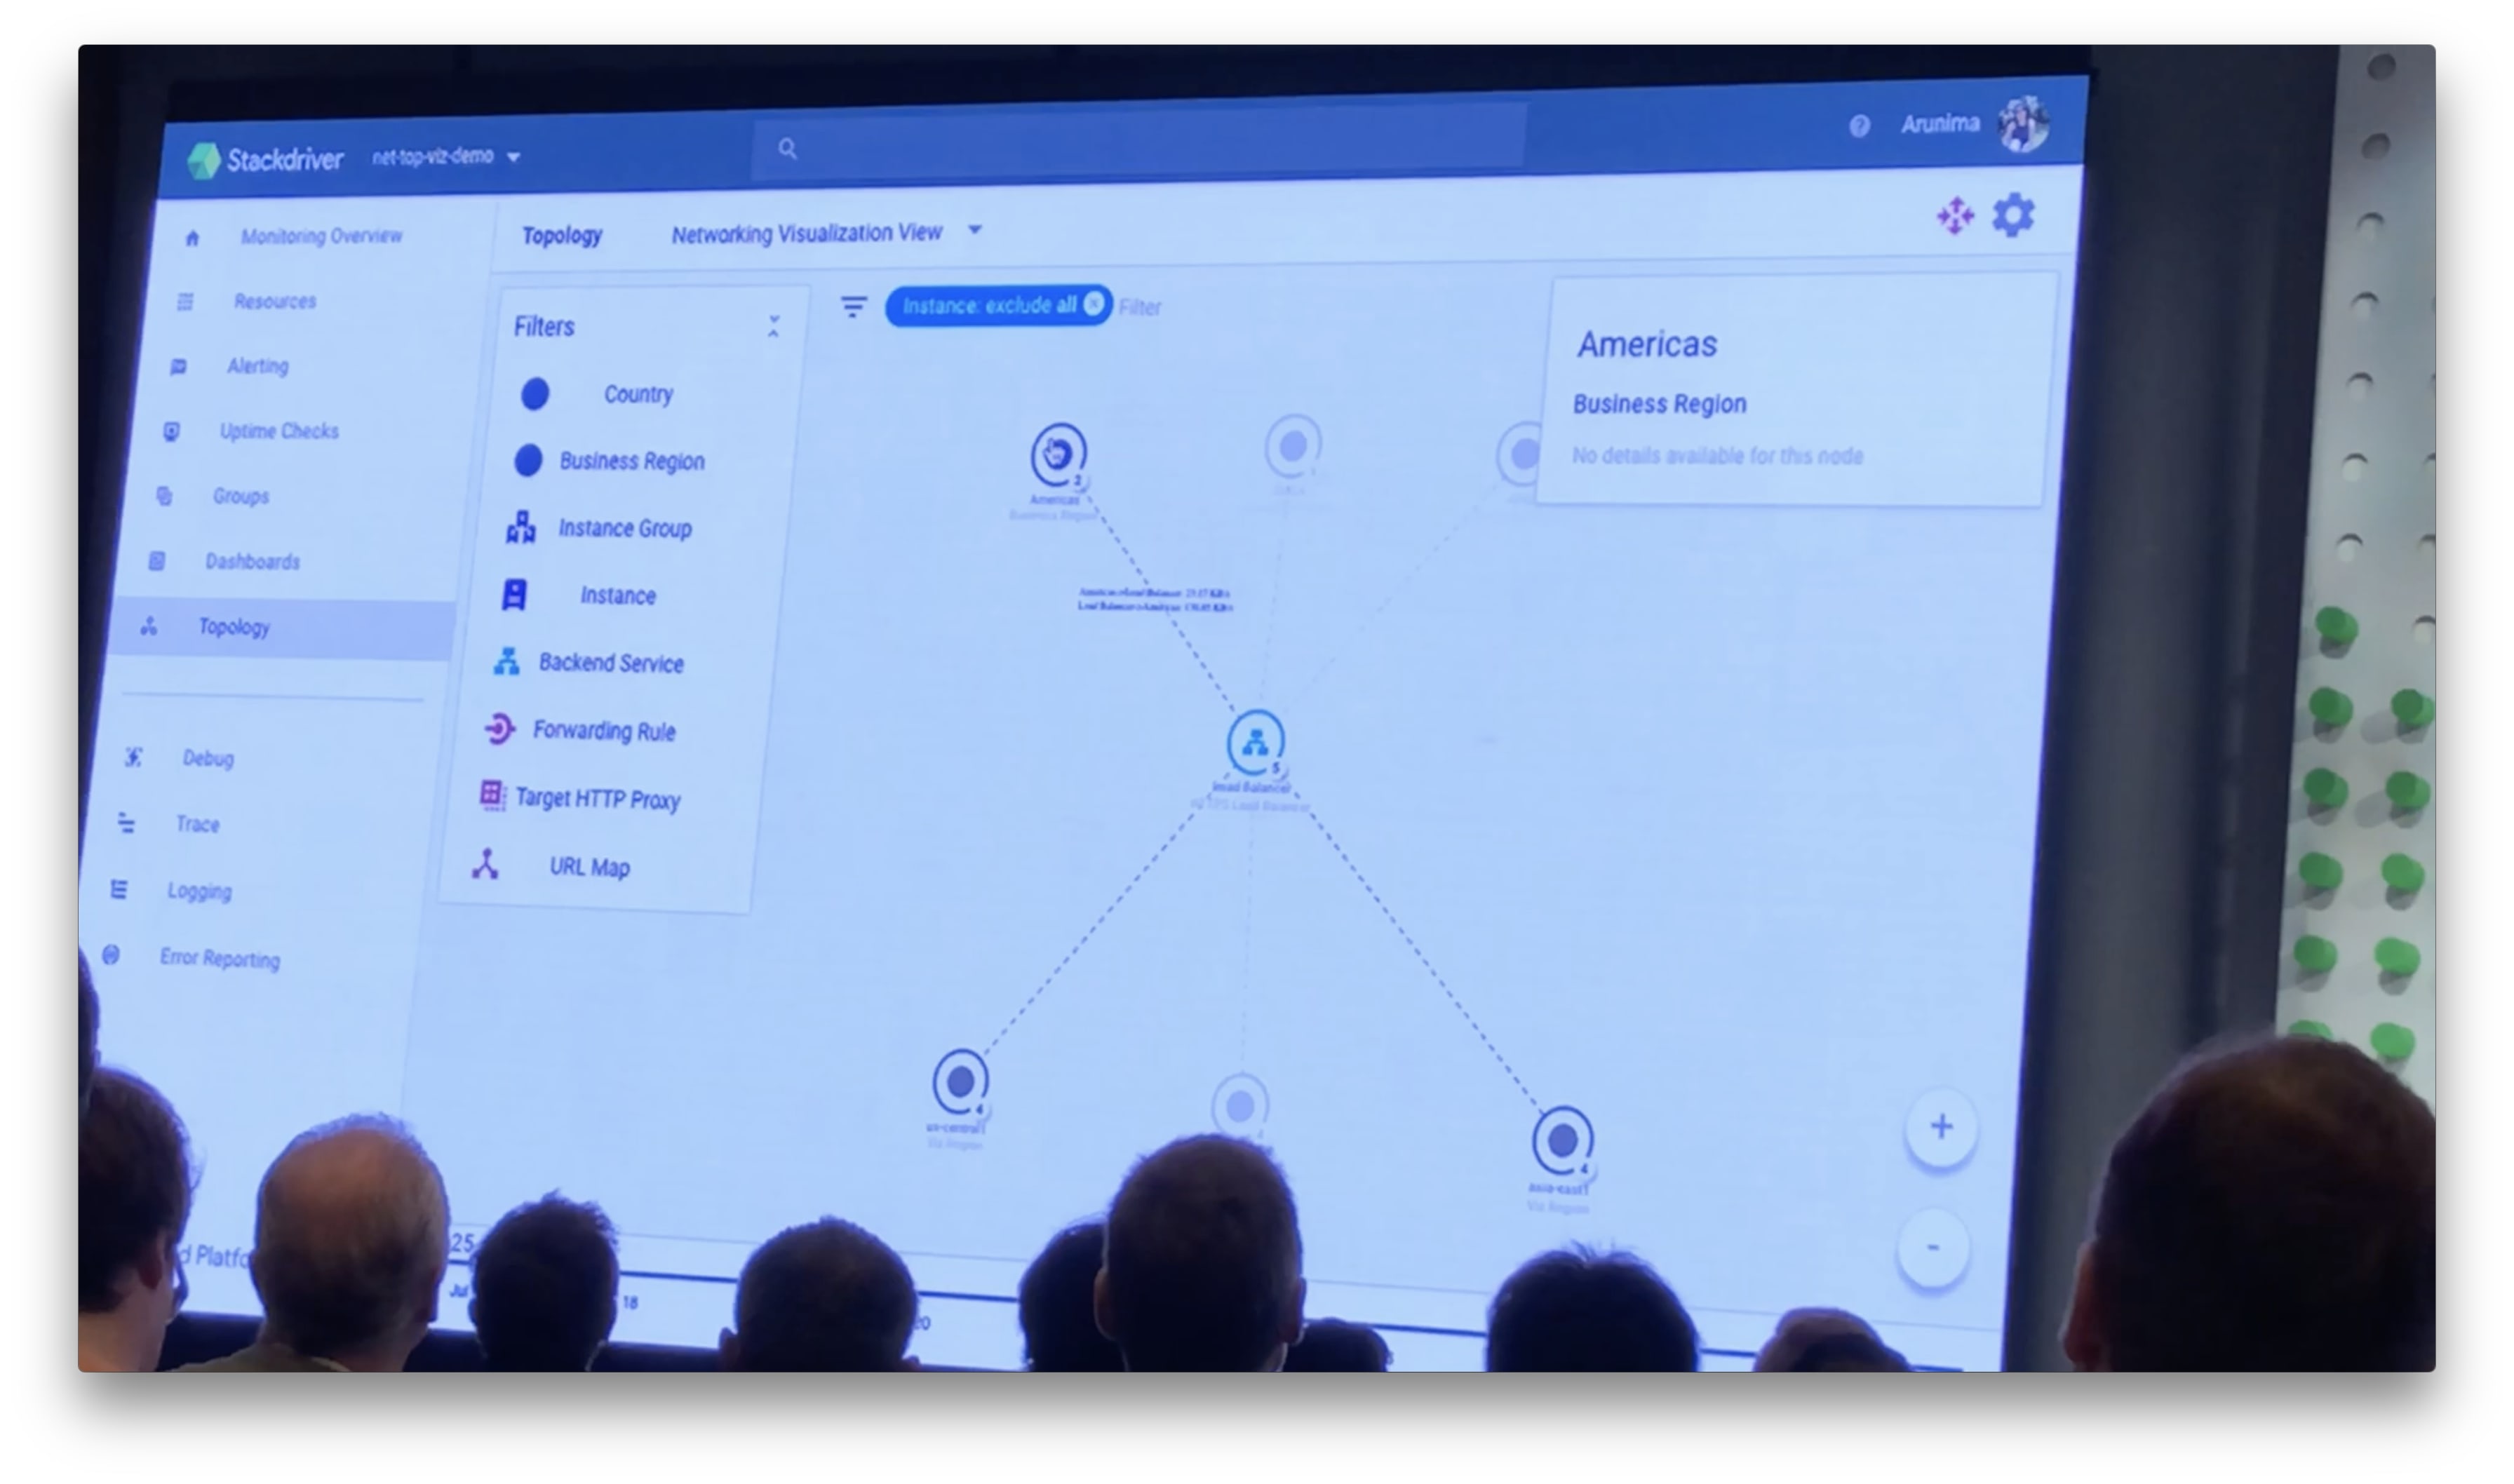
Notice that, when selecting the Americas region, multiple regions are receiving traffic via the balancer. This indicates a fault in the project configuration and will result in sub-optimal performance for the services served to the Americas, but routed to APAC.
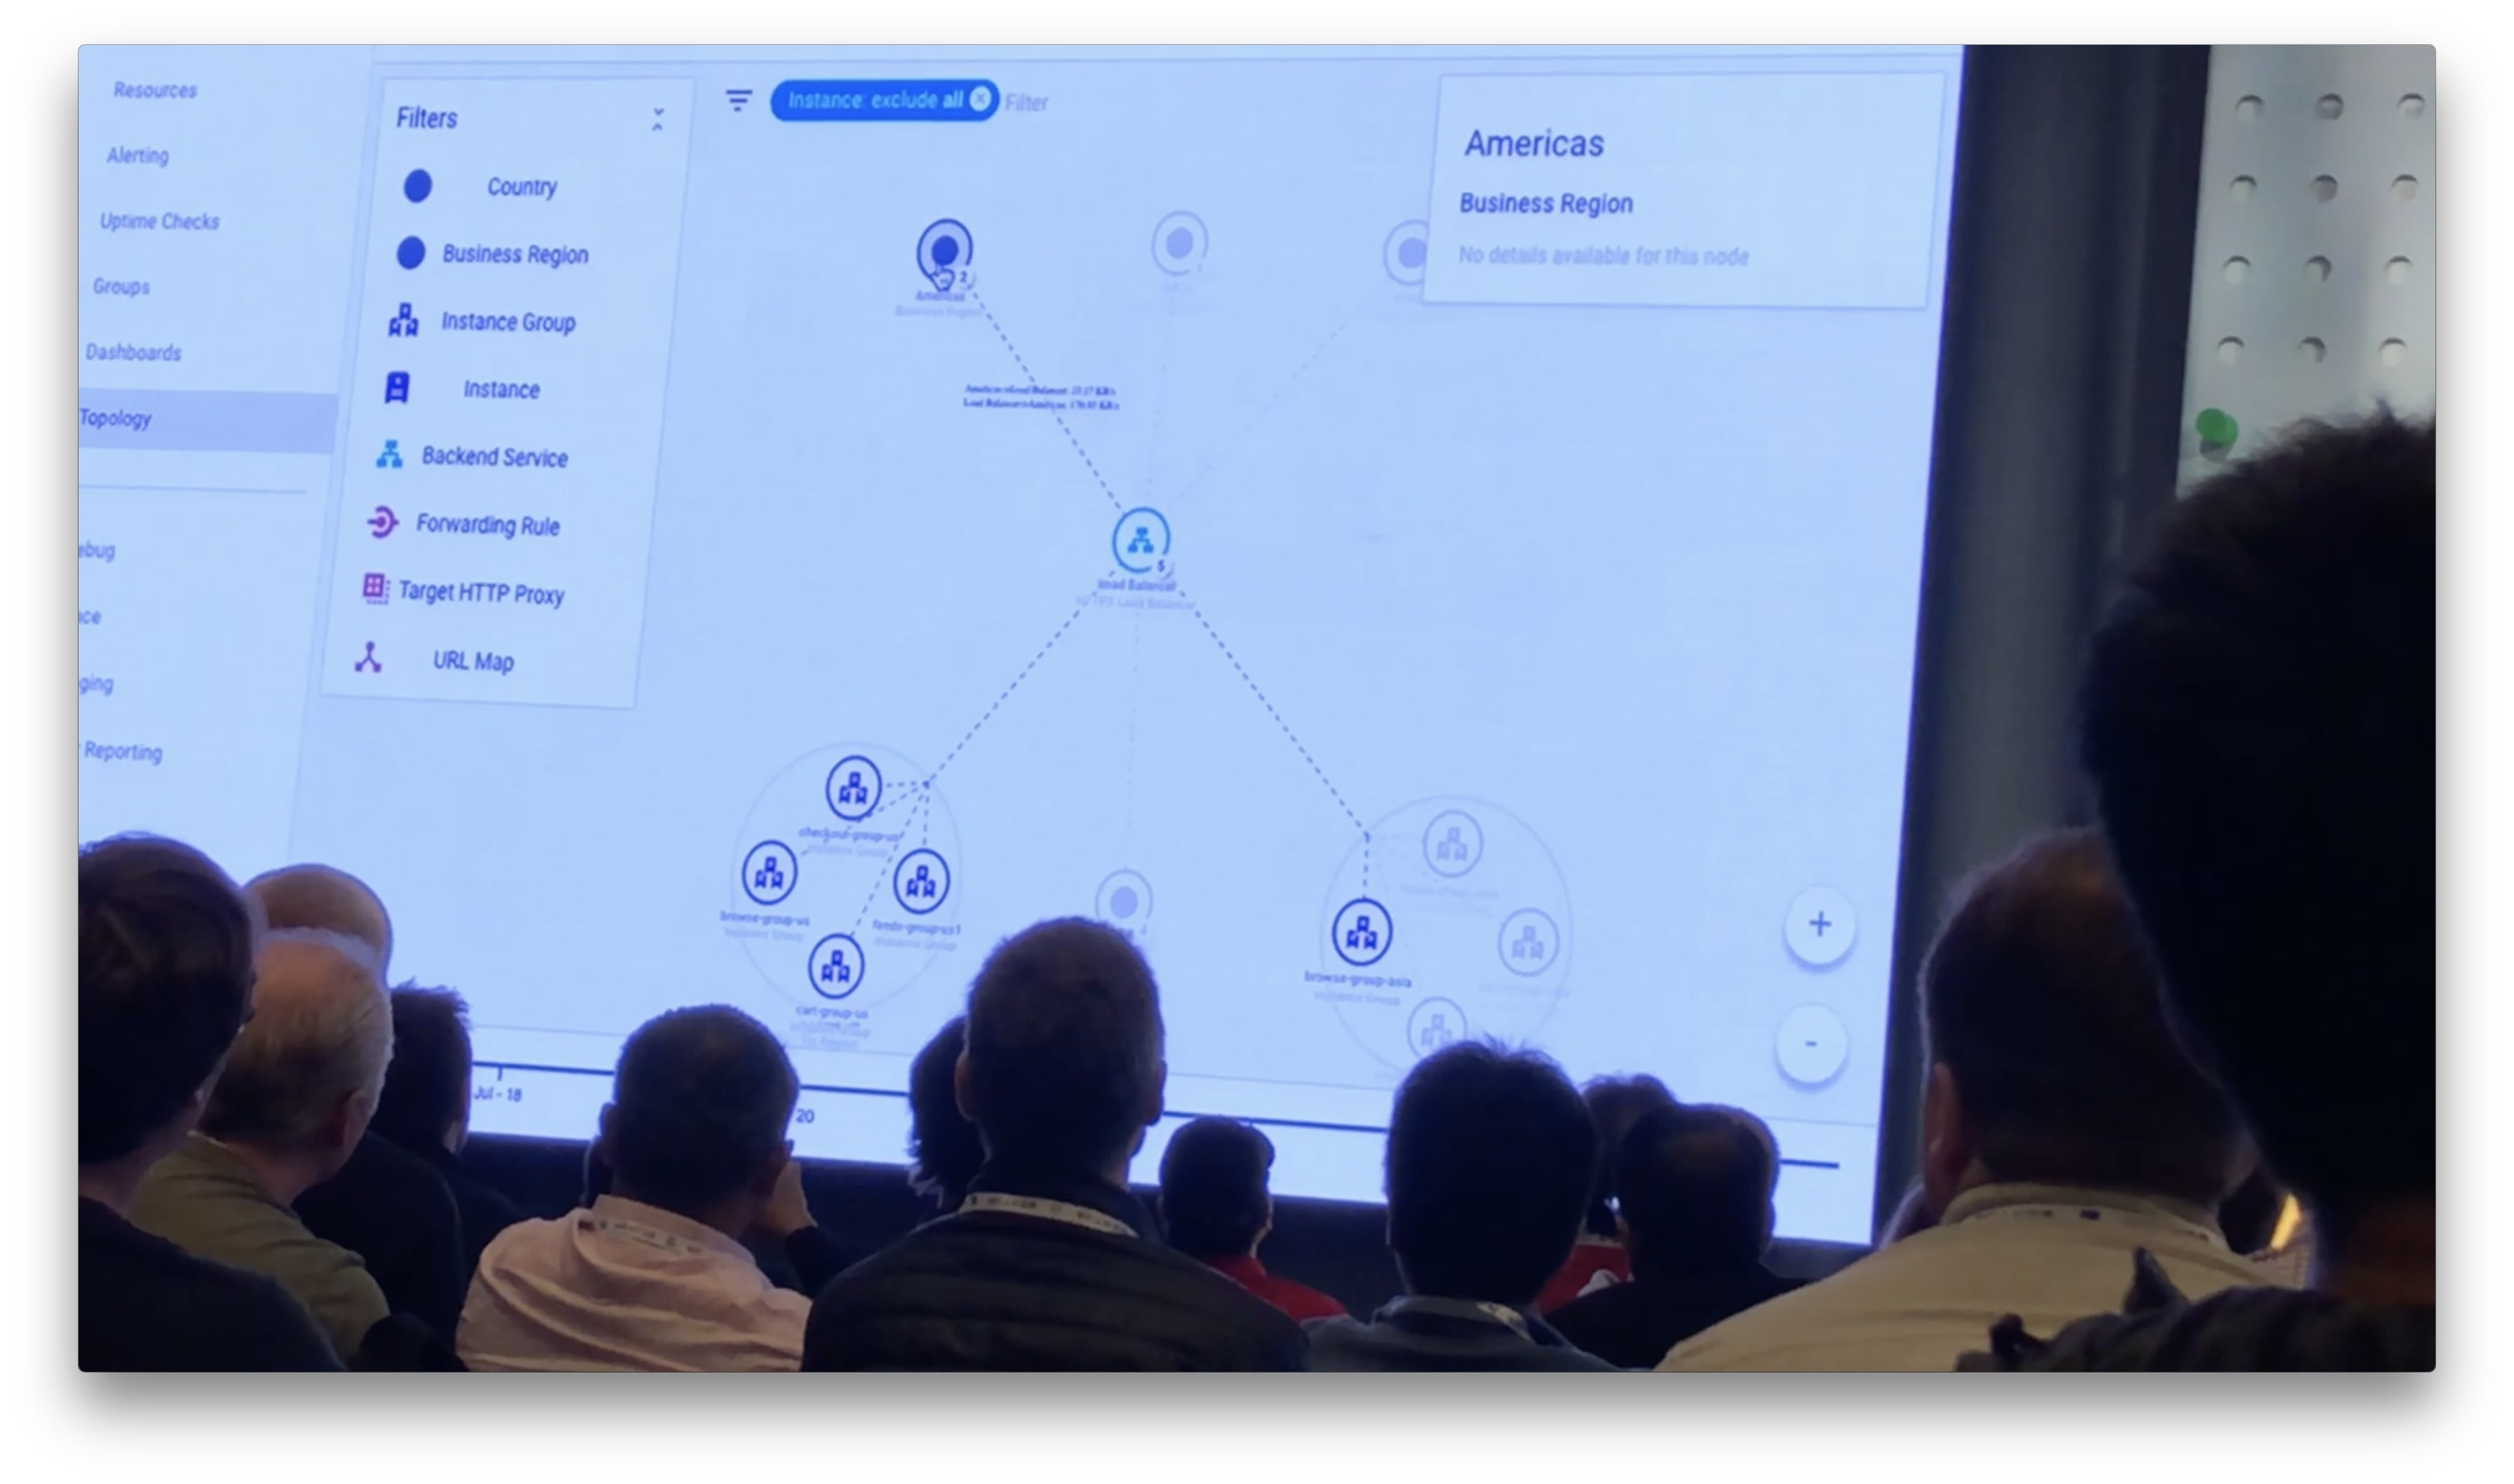
Further selecting the APAC compute region of the graph exposes the compute groups within that region with additional network stats.
With both the compute regions in APAC and the Americas expanded a user can select the Americas region to see, specifically, where traffic is flowing within APAC, which compute group(s).
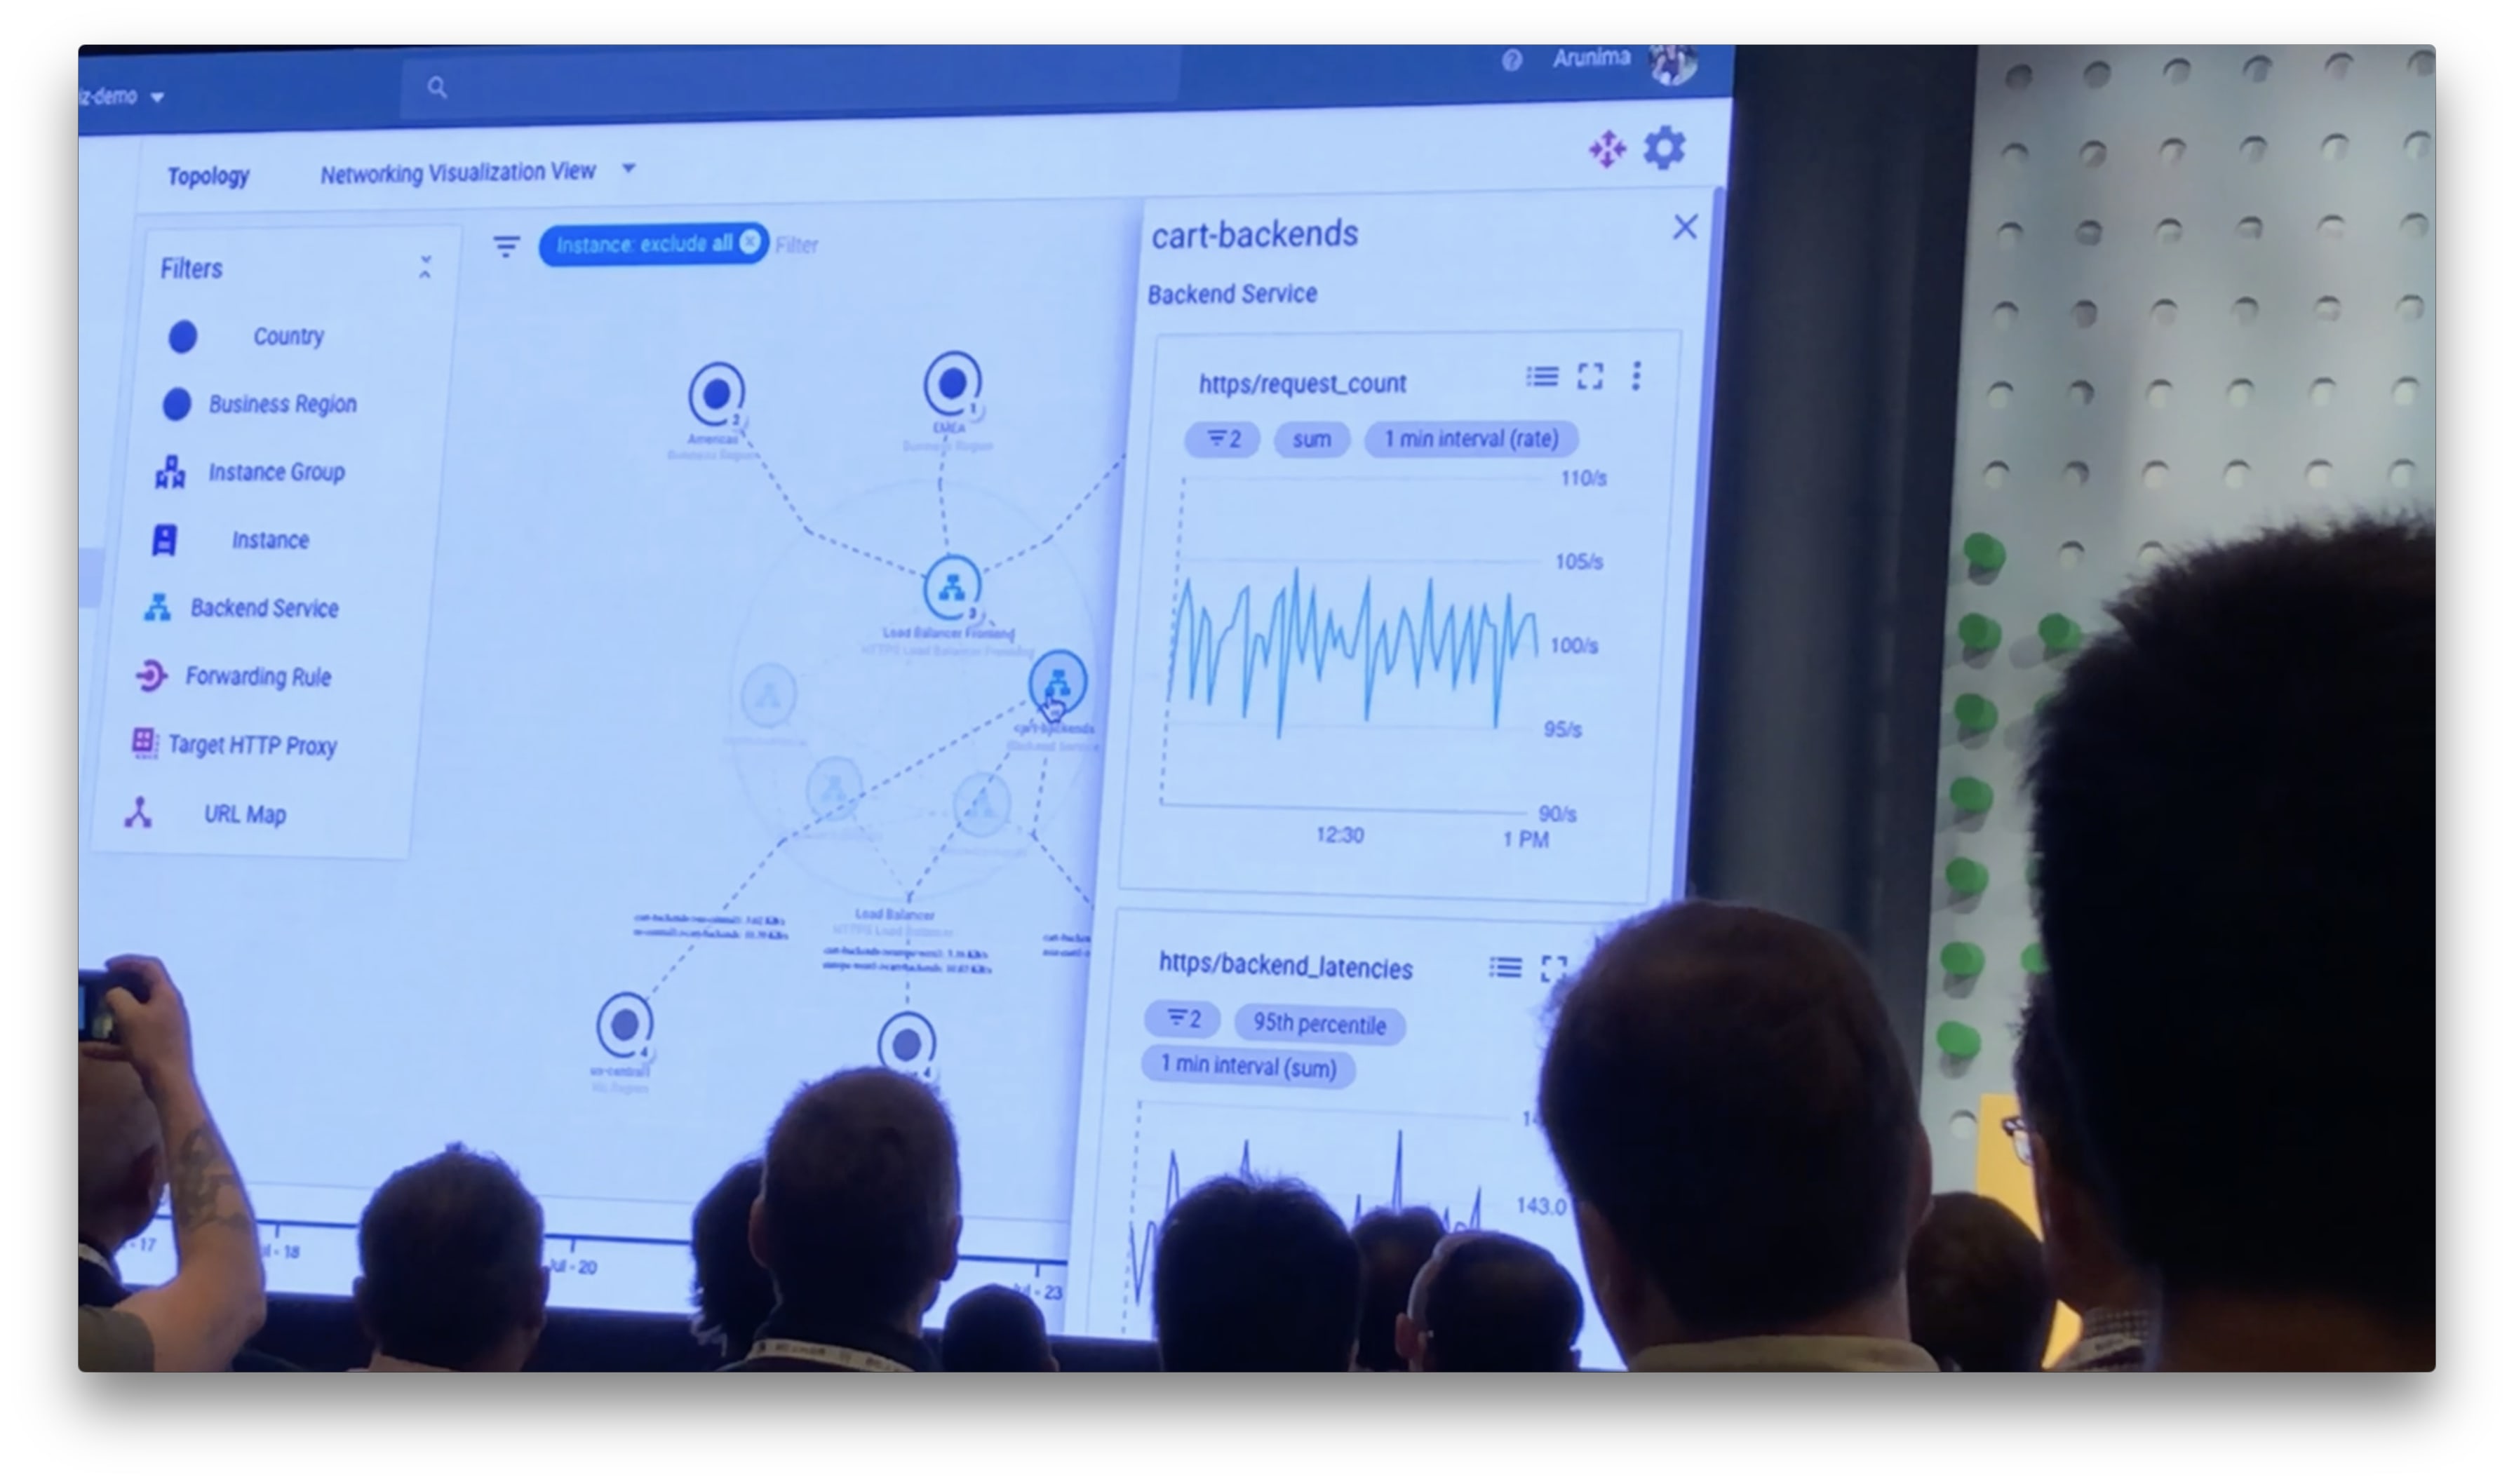
Much like compute regions, load balancers can also be selected to show additional details about their configuration. Selecting the load balancer in this case shows all the particular backend services, their dependencies based on up/downstreams and network stats.
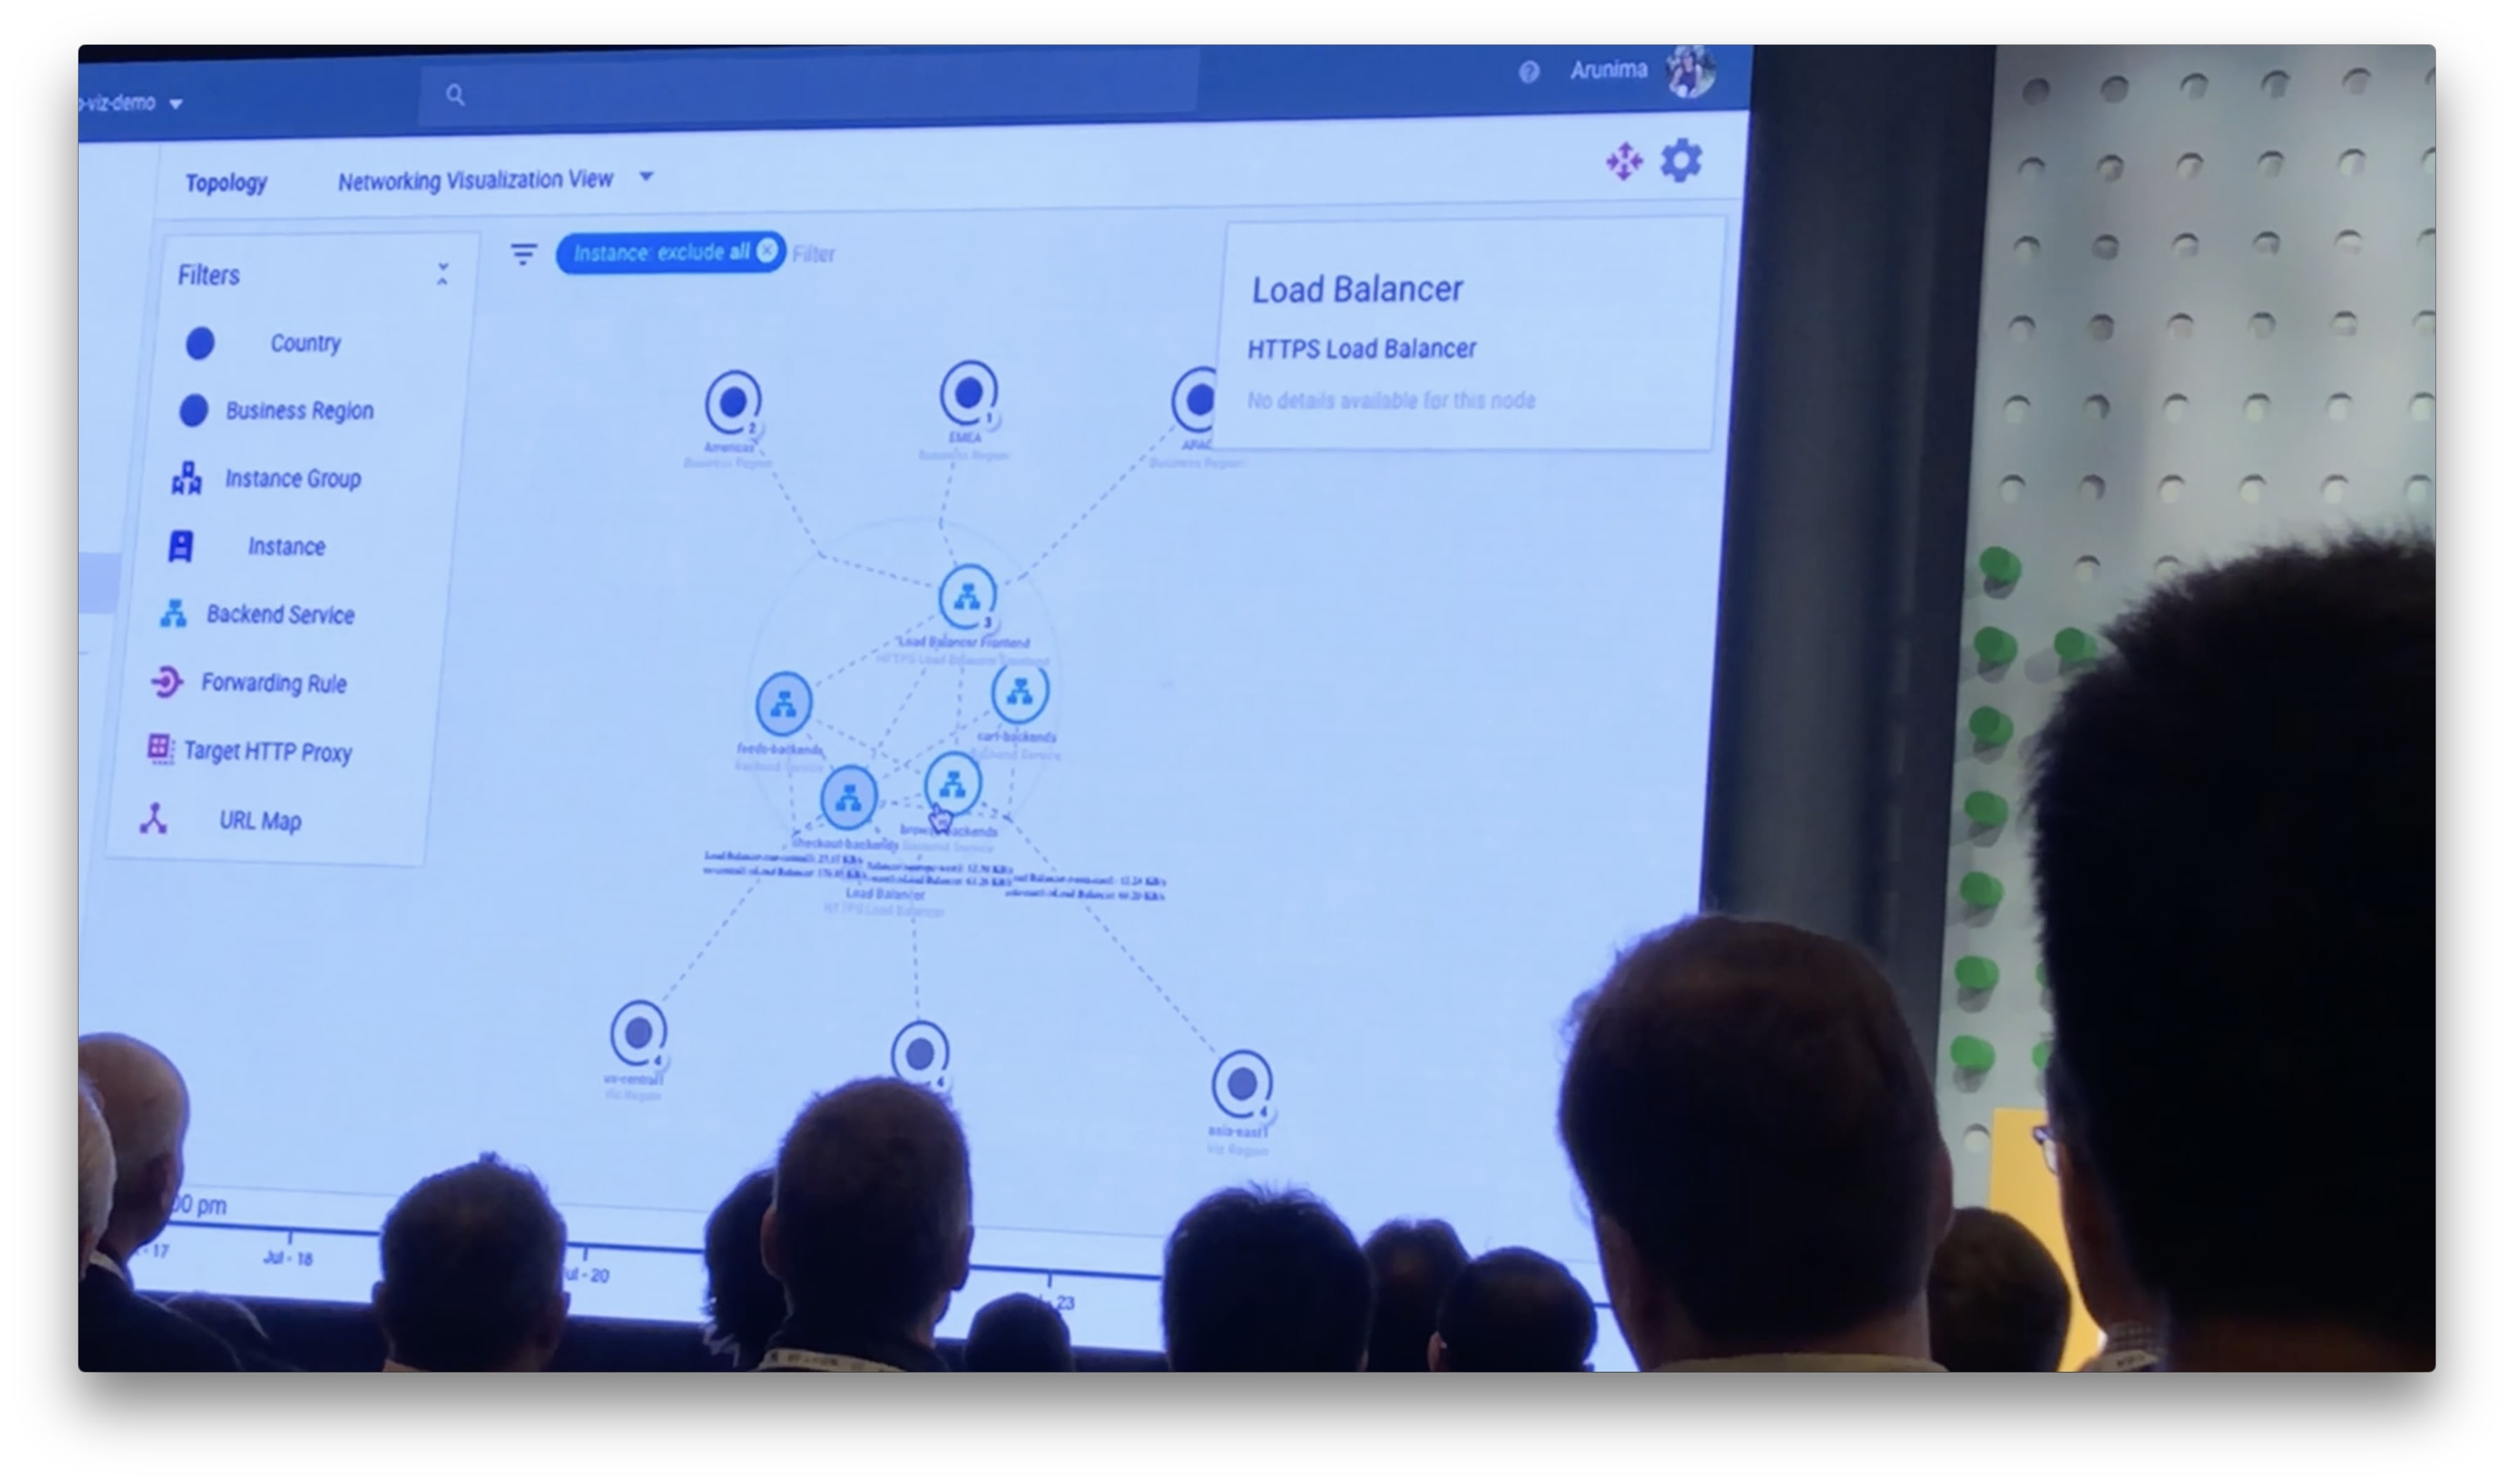
Additionally a user can pick a particular backend service to show additional Stackdriver metrics showing request count and backend latencies for the service. The views allow users to discover problems in cross regional network configurations and configure alerts that might indicate sub-optimal configurations and ultimately experiences for end-users of services.