Reading sensor data from Canary
I purchased a Canary the other day to keep an eye on the beasts while I’m away. I live on the ground floor in San Francisco, so… you never know. In addition to basic security via motion video capturing and alerting, Canary has a suite of sensors, including:
- Humidity
- Temperature
- Air Quality
- Ambient Light
- Internal Temperature
- DB Level (noise)
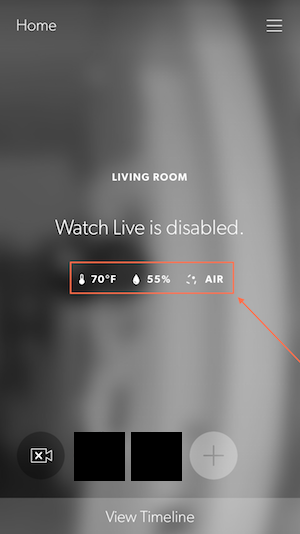
The mobile app renders data for the first three sensors within the past 24 hours. A day is nothing and I was interested in getting data for more than the past 24 hours. Thus, I began an investigation into capturing or (more appropriately) querying for that data.
Note: I did not ask Canary support if this data is available for consumption, which one could argue a reasonable person would do first.
My investigation into how this data is stored, where it’s stored, and how to get the data, was rooted in the inspection of the network traffic coming from Canary. I specifically set out to capture the (likely) REST endpoints used by Canary when it phones home and transmits data.
Using Wireshark, I attempted to perform a man-in-the-middle (MITM) attack on my home network – aimed at traffic to / from the Canary and the outside world (my router). A MITM attack confuses the switch in-between into sending packets destined for other hosts (ports) to your machine for inspection. If your Canary is connected to a hub you need not worry about such a practice, you just listen and receive…
Unfortunately for me, it’s been a long time since I’ve used Wireshark and I didn’t get too far. Specifically, I don’t think I was properly setting up the MITM attack and thus was unable to inspect traffic coming from what I confirmed to be Canary’s IP and adapter address.
The next option was to try and capture traffic to and from the Canary app on my iOS device. There are a number of ways to do this – I settled on using the Remote Virtual Interface Tool in OS/X to capture data. This is helpful, in general, and easy. To do so:
- Connect your target iOS device to your machine.
- Install / open XCode, open devices, select your iOS device and get it’s identifier.
- Create an interface for the device traffic by issuing:
rvictl -s. This will create the interfacervi0. - Dump the packets from this interface by issuing:
sudo tcpdump -i rvi0 -w trace.pcap - Goto your mobile device and perform whatever operations you think will request network resources (ex: force close the app, open the app, goto target screens, etc…)
- When you’re done, kill
tcpdump. Your data is intrace.pcap. - Finally, instruct the Remote Virtual Interface Tool to stop your previously created device,
rvi0, by issuing:rvictl -x - Open Wireshark and your
trace.pcapfile. TADA!
Capturing traffic from the iOS Canary app yielded meaningful data such as the API DNS, port, etc… but I was still restricted by my amateur Wireshark skills.
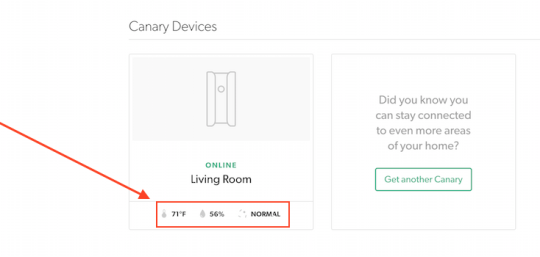
After more or less giving up on packet inspection, I turned to the Canary dashboard. This dashboard contains simple things like your plan, billing method, address, associated users, and associated devices. It also shows a current snapshot of the Temperature, Humidity, and Air Quality.
Further inspection of the dashboard revealed the site is an Angular app. The app makes REST calls to Canary’s API from your browser to render data on the page. Using Chrome developer tools (or any other browsers developer tools), one can deduce the series of executed API calls. One such call (which does not require authentication or authorization), obtains the suite of sensors and their IDs. There are subsequent calls to get the associated device or devices with your account.
Using this information and the bearer token in local storage, angular makes individual calls to get your sensor data using the (1) device ID (2) date range of now to now (3) record result size limit and (4) the sensor ID.
Ex GET request: [https://my.canary.is/api/readings?created__range=2015-10-29T23:59:44.961Z,2015-10-30T00:09:44.960Z&device=XYZXYZXYZ&limit=1&sensor_type=1](https://my.canary.is/api/readings?created__range=2015-10-29T23:59:44.961Z,2015-10-30T00:09:44.960Z&device=XYZXYZXYZ&limit=1&sensor_type=1)
Ex CURL execution: curl [https://my.canary.is/api/readings\?created__range\=2015-10-29T23:59:44.961Z,2015-10-30T00:09:44.960Z\&device\=XYZXYZXYZ\&limit\=1\&sensor_type\=1](https://my.canary.is/api/readings%5C?created__range%5C=2015-10-29T23:59:44.961Z,2015-10-30T00:09:44.960Z%5C&device%5C=XYZXYZXYZ%5C&limit%5C=1%5C&sensor_type%5C=1) -H 'Authorization: Bearer YOURBEARERTOKEN'
…yields the response:
{
  "meta": {
    "limit": 1,
    "next": "\/v1\/readings\/?device=XYZXYZXYZ&sensor_type=1&offset=1&limit=1&created__range=2015-10-29T23%3A59%3A44.961Z%2C2015-10-30T00%3A09%3A44.960Z",
    "offset": 0,
    "previous": null,
    "total_count": 10
  },
  "objects": [
    {
      "created": "2015-10-30T00:08:48",
      "device": "\/v1\/devices\/abc123abc123abc123\/",
      "id": 1,
      "resource_uri": "\/v1\/readings\/1\/",
      "sensor_type": {
        "id": 1,
        "name": "humidity",
        "resource_uri": "\/v1\/sensors\/1\/"
      },
      "value": "71.3271560669"
    }
  ]
}
Success!
Manipulate the date ranges, sensor type ID, and response limits to get more data captured / stored by Canary. Interestingly enough, the sensors appear to report data once-per-minute, yielding plenty of data to play with.
Note: Doing so, or making too many requests, will probably get you noticed and might be a violation of terms of use (or something).